
How to create dashboard with SQL Server database
Build beautiful SQLserver SQL reporting dashboards
This article will address the following topics as well
- How to create SQL Server dashboards ?
- How to build online reporting dashboards for your business?
Easy Dashboard Reporting with SQL Server
Microsoft SQL Server is a relational database management system developed by Microsoft. As a database server, it is a software product with the primary function of storing and retrieving data as requested by other software applications�which may run either on the same computer or on another computer across a network (including the Internet).
InfoCaptor works with SQL Server using jTDS jdbc driver. http://jtds.sourceforge.net/
Some more information on connection issues with SQL server https://www.infocaptor.com/jdbc-with-sqlserver-connection-refused-connect
SQL Dashboards are very easy to build and deploy with InfoCaptor. SQL Dashboard eliminate the need of a data-warehouse or presentation layer like in OBIEE as it goes straight to the database. It leverages the SQL’s native processing power for aggregation so for 50% of the use case you don’t need a heavy duty ETL framework etc. The good thing is if your data-warehouse is in other database like Oracle and transactional data in SQL server you can report all of them together on the same infocaptor dashboard.
InfoCaptor
SQL Server
Excel/CSV Data
Benefits of SQL Server database dashboard
Instant Visibility. A SQL Server dashboard visually summarizes all the important metrics you have selected to track, to give you a quick-and- easy overview of where everything stands. With real-time SQLserver SQL reporting reporting, it’s a live view of exactly how your marketing campaign is performing.
- Better Decision Making
- Gain Competitive Advantage
- Enhance Collaboration
- Spotting potential problems
- Merge with data from Excel Dashboards
- Live SQL against database
- No need for Data-warehouse or ETL
- Leverage the speed and stability of your powerful database.
Check out the Top 10 Tangible benefits of Excel dashboards
“Five minutes into using InfoCaptor and you will know that you found a mission critical product. InfoCaptor helps you see your data from different angles like a CSI investigator on a crime scene. It helps visualize endless data, perform real time analysis and tell you where to focus your attention, what are the opportunities to invest your capital. The return on your InfoCaptor investment is guaranteed on your first project”
Steps to build SQL Server database dashboard
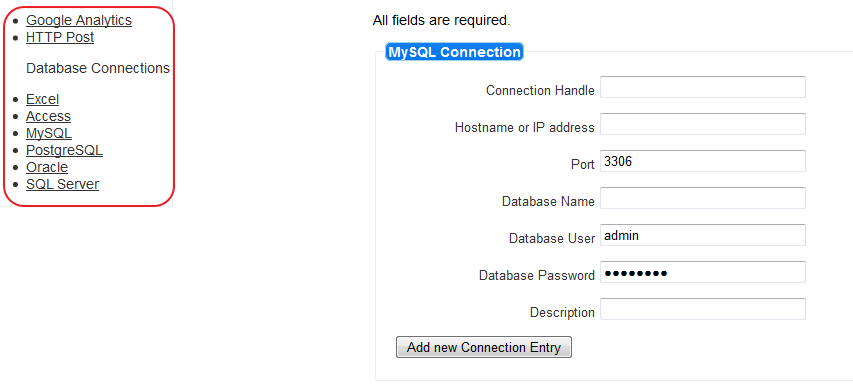
How to create SQL Server database connection
SQL Server supports both ODBC and JDBC connections. To work with Databases, you would need the following Connection details like
- SQL Server server IP or name
- SQL Server database name
- SQL Server port number
- SQL Server user and password
Check out the InfoCaptor SQL Server connection details
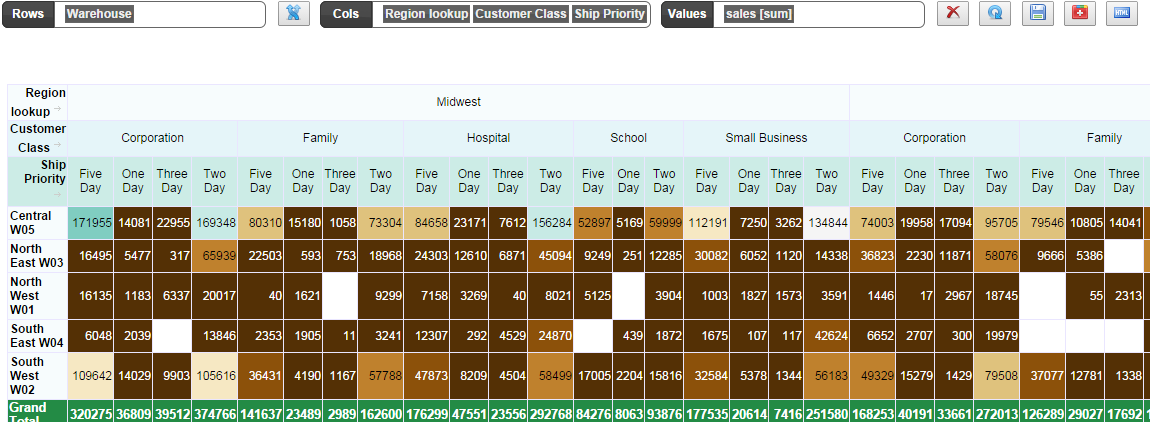
How to build SQL Server pivot table for dashboard reporting
InfoCaptor provides powerful visual analytics for SQL Server and you simply point to the table in your SQL Server schema or database. Pick your columns and put them in rows or columns.
One of the first things to do for data analysis is to browse your SQLserver SQL reporting data and chart different varieties of Pivot Tables. Pivot tables is one of the simple and yet powerful visualizations. InfoCaptor’s entire visualization engine is based on pivot tables. Check the detail steps on how to build Pivot Tables views for SQL Server data
Create bar charts and line charts for SQLserver SQL reporting tables and views
Once you have a visual clue about your SQL Server data using pivot tables, it becomes very easy to convert into bar chart, line chart or any other chart. Check this picture, how SQL Server data is visually mapped between pivot table and bar chart
Create Advanced d3.js charts for SQL Server tables and views
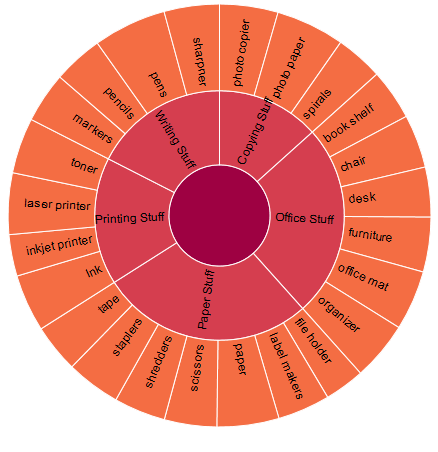
While you can create pivot tables and bar charts that are very common display types for majority of dashboard reporting, InfoCaptor liberates you from the basic chart types by providing advanced d3js based hierarchical visualizations. Your SQL Server reports can easily incorporate circle pack, sunburst, cluster and treemap diagrams. Sankey Flow diagram for your sqlserver analytics data is also an excellent choice for quick data analysis.
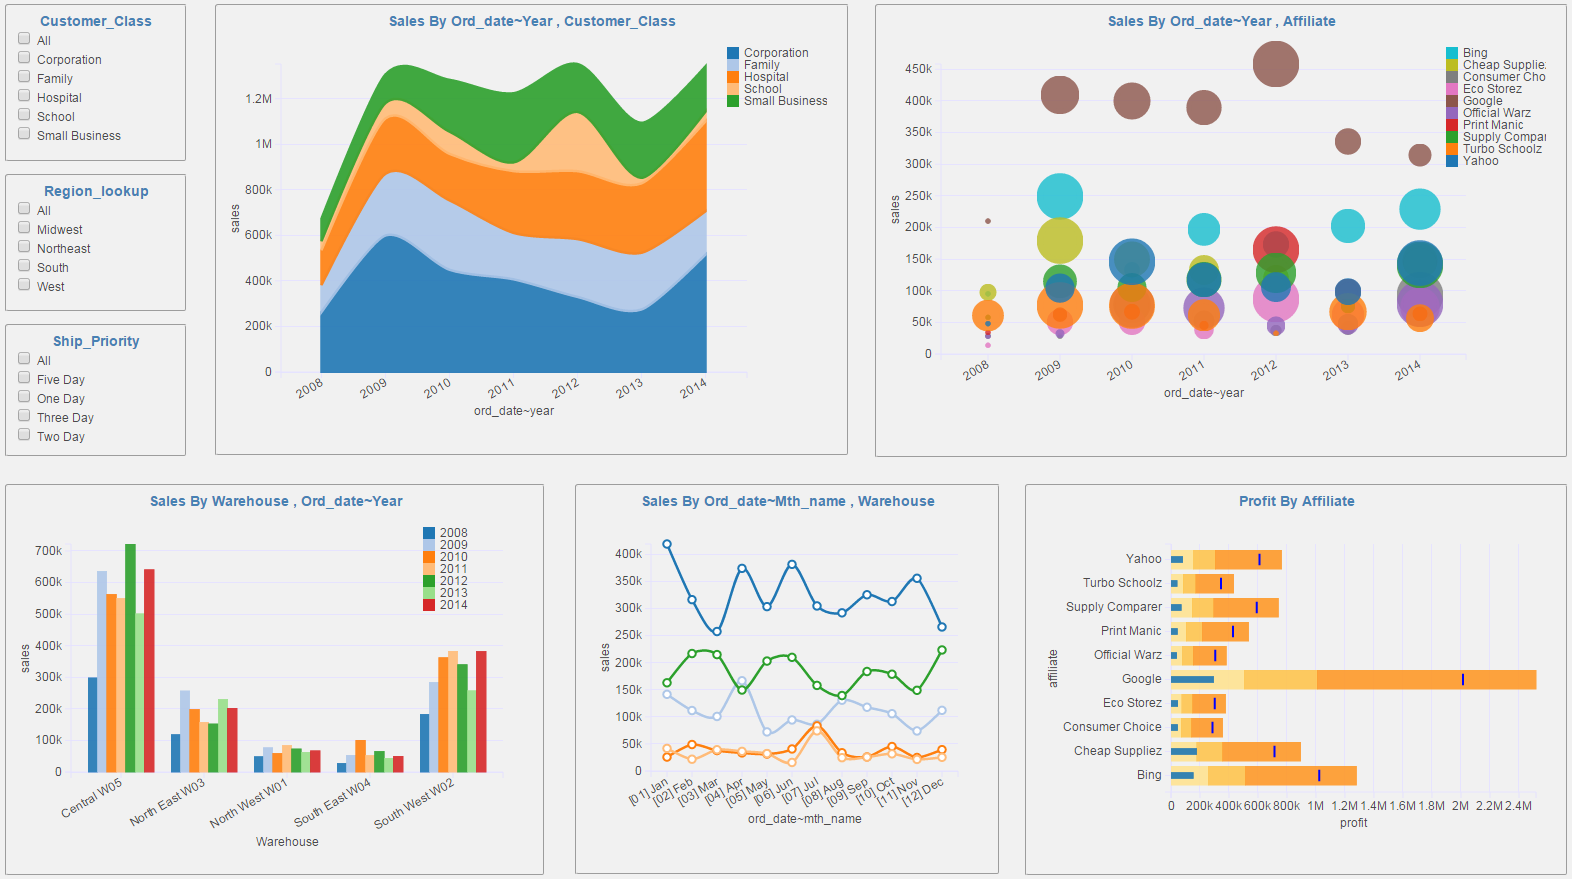
Add SQL Server based analysis/report to dashboard view
- Once you are happy with your analysis in the visualizer you can add it to the dashboard
- Keep adding as many analysis you need to the SQLserver SQL reporting dashboards
- Add dashboard parameters to the SQL Server reporting page
Finalize and Publish your SQLserver SQL reporting dashboard
Once you are done with the dashboard, you can share the dashboard with ohter users.
- Public sharing: Share dashboard as public URL
- Inivite users to your group and share it via group