LogTiger Analyzer is easy to use Log Analytics software. LogTiger allows you to create unlimited projects and upload log files. It comes packaged with stunning dashboards and reports for Log Analytics.
How can Log Analysis help Technical SEO?
Following is the list of some questions that can be easily answered with LogTiger
Who is accessing your website?
What bots are visiting and indexing pages?
Can you identify spam traffic or traffic from spam bots?
Is Google or Bing able to access and index all your important pages?
Which of your pages are having technical issues?
What are your top crawled pages by each bot?
What is the crawl frequency by each bot?
Log Analytics with easy to use dashboards and reports
LogTiger is built on top of InfoCaptor Dashboards and it comes packaged with the following set of reports and dashboards.
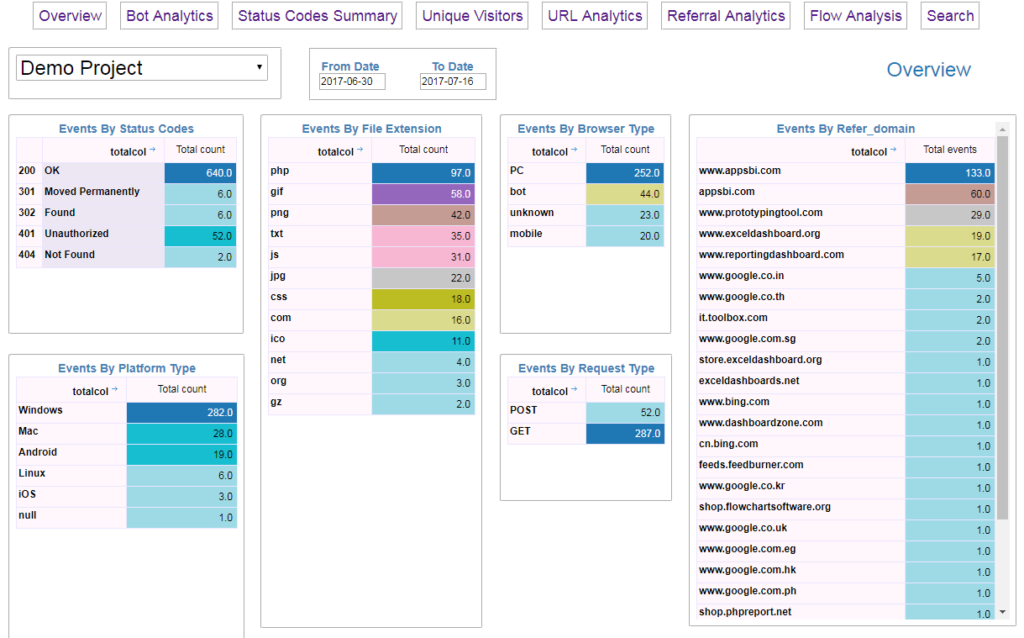
Overview Dashboard
Log Analytics Overview dashboard displays summary of all events by different categories and dimensions. You can see total events by status codes, file types, browser type, operating system,platform type, request type and referrer.
Bot Analytics Dashboard
Bot Analytics displays Crawl Budget,Crawl bandwidth, Crawl Hits, Unique URLs crawled by each bot. You can see which bots visit your site. It displays the URLS visited and also the frequency of their crawl visits.
Flow Analysis Dashboard
Flow Analysis dashboard shows the flow of traffic from the request type to browser platform to the final browser. For e.g it displays the relationship between the number of events that do GET and POST and which platform mobile
Status Code summary Dashboard
This is a very crucial dashboard in determining the various HTTP status by different file types. You can easily see which file types produce 3XX and 4xx errors and drill down to the exact file location.
Unique Visitor Dashboard
This dashboard displays the unique visitors to your website. It displays the total unique hits by the date range you have selected as a pivot table across the hour of the day.
URL Analytics Dashboard
URL Analytics displays top level metrics such as total events, total bandwidth and number of visits by each bot. It also displays the various status codes against each URL.
Referral Analytics Dashboard
Referral Analytics displays all Referral URLs and top level metrics such as total events, total bandwidth and number of visits by each bot. It also displays the various status codes against each referral URL.
Search Dashboard
Search dashboard simply allows you to search for any string across all the log events. It provides quick filters for status codes and date range. You can search on URL, Referral, User agent and browser strings.
Custom Dashboard
All your parsed and uploaded data is store in MySQL db. LogTiger provides access to InfoCaptor’ visualizer and dashboard editor. With this powerful feature you can do data discovery on your log data and build custom dashboards.
Benefits of Log File Analysis
Benefits
Check Page Errors
Find Broken Links
Find How much crawl budget is wasted
Improve Areas of crawl deficiency
Identify Large/slow pages
Discover Crawl frequency by search bots
Identify Most crawled pages
Indentify Least Crawled pages
Reports and Dashboards
Snapshot Overview
Bot Analytics
Status Code Summary
URL Analysis
Referral Analysis
Flow Analysis
Unique Visitors
Search URL/Referrer/User agent etc
LogTiger includes complete InfoCaptor dashboard editor so you can build custom reports and dashboards using your log data.
Unique Features
Web based interface that you can download
Unlimited Projects
Unlimited uploads
Converted logs are stored as CSV
Converted logs are also uploaded to MySQL tables
Packaged with InfoCaptor Data Visualizer and Dashboard
How to analyze logs with LogTiger
Create a Project
A project will hold all the log files together. For e.g each website along with its sub-domain logs can belong to a single project or you can create project for the main site and separater project for each sub-domain.
Upload Log File
Once you create the project, it will ask you to upload the log file. Make sure you select the project before uploading the log file. Once uploaded the log file will be processed in two stages. First it will parse the log and convert into a CSV file. In the second stage it will upload the CSV file to the in-built MySQL database. Once the data is loaded it guides and navigates to the dashboard.