Publish and Share dashboards with your clients and users
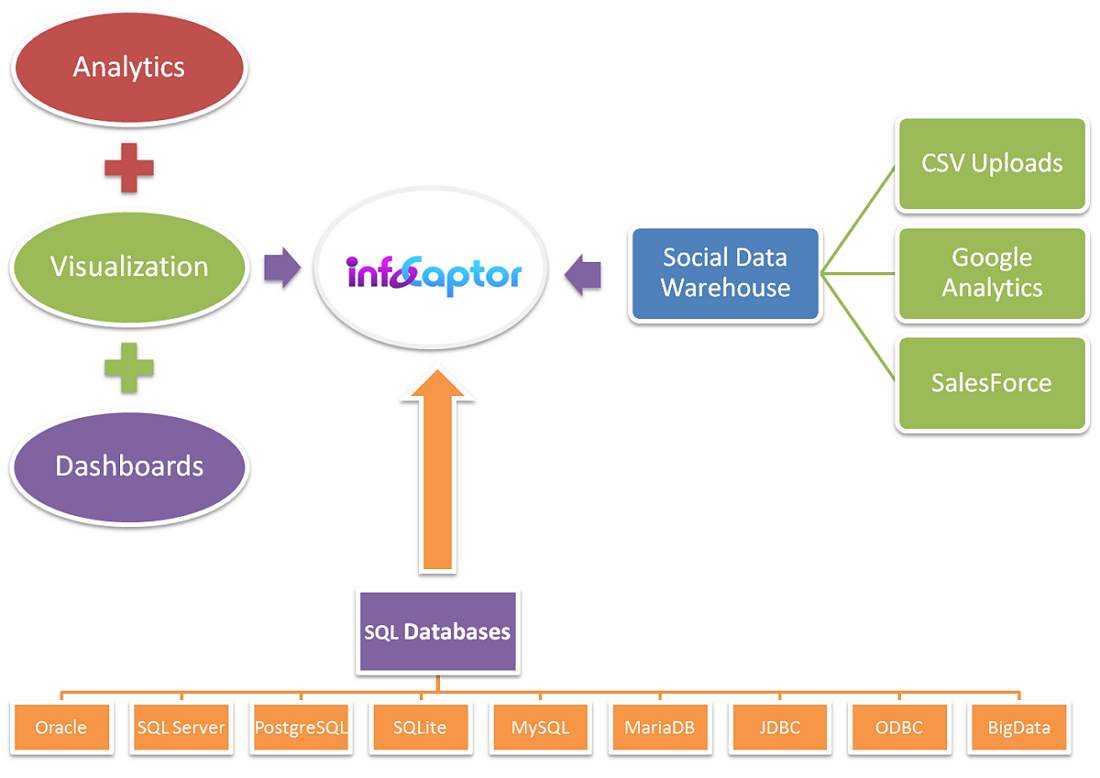
The above dashboard is live and real. The metrics are collected automatically on a daily basis. The dashboard is built with the MySQL table as the source. So no matter when the background daemon runs the Google analytics API, the dashboard will always remain operational.
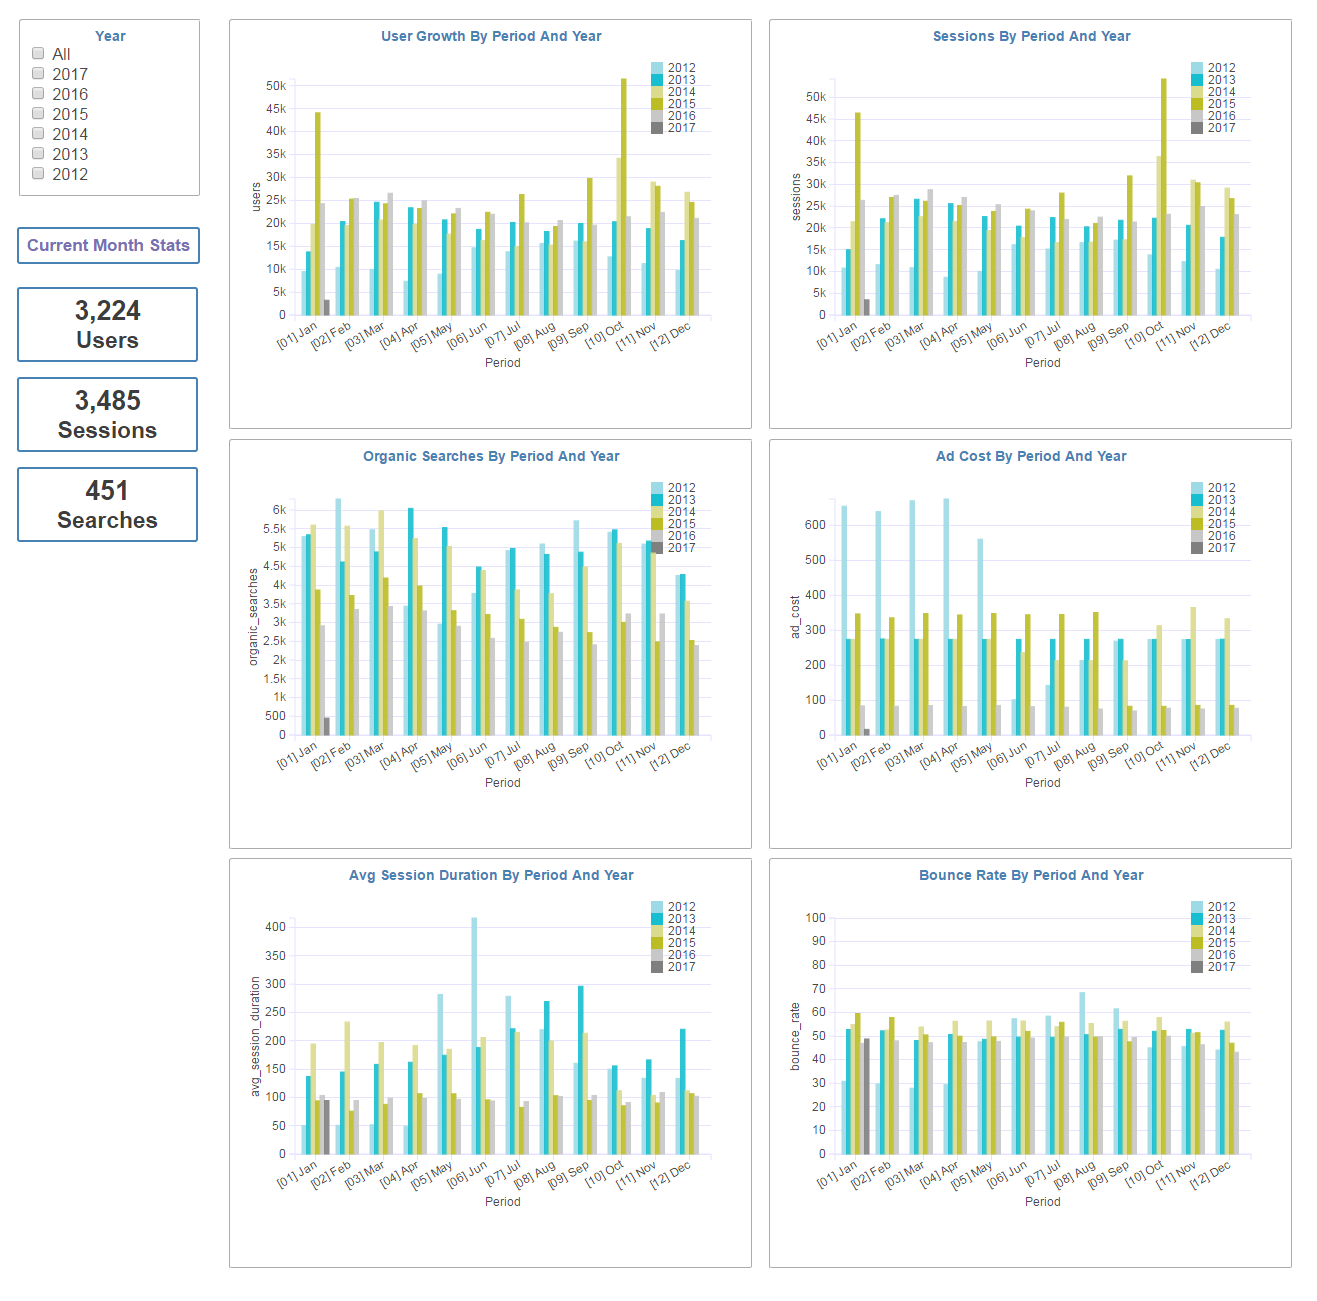
Following is the list of metrics displayed on the Analytics dashboard. Each of the metric is visualized in similar manner for easy comparison and co-relation. The legend is set with the year dimension, so within each period you can see how the metrics trended across year and that period.
- User growth by month and across multiple year
- Sessions by month and year
- Organic searches by month and year
- Adwords cost by month and year
- Average session length by month and year
- Bounce rate by month and year