
All of these icons are vector Icons so you can scale them to any size without loosing any details
You drag any icon from the left panel to the center work area. Once dragged, you can click on the icon to get it selected
Icons now can be stretched to any size by dragging the blue border
wireframe Icons can be filled with any color Make sure the Icon is selected and then click on the top Fill color button on the top tool bar
You can also make the Icon appear without any color, just like a wireframe
Icons line width can be changed as easily
You can also add Text inside Icons. Double click to launch the edit dialog
Replacing Icons
- Click on the Icon so a blue selector border appears around it.
- Right click on any icon in the left panel.
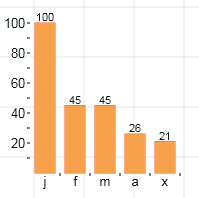
Prototype Data Double click on the chart to invoke the grid editor
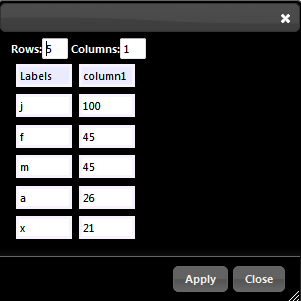
Change data and click Apply To view data as Text Right click on the chart and select “Edit Text“
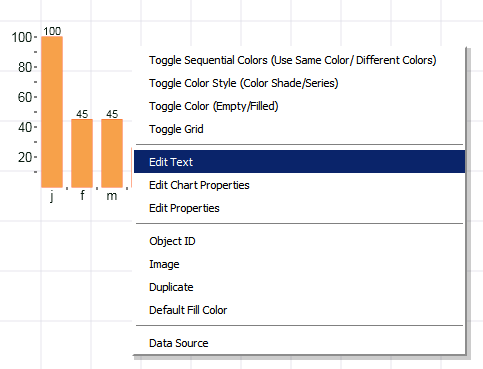
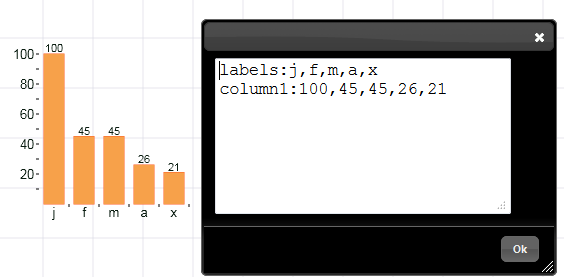
Chart Properties You can easily manipulate chart’s display properties by invoking the “chart properties”Right click on the chart and select “Edit Chart Properties”