
You can modify the behavior and appearance of visualizations by changing the default properties. There is only one place to modify properties for all kinds of visualizations.
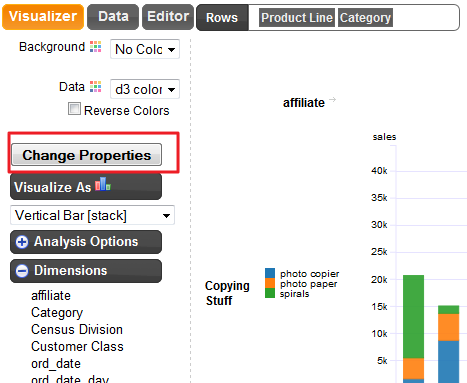
Click on the “Change Properties” button to invoke the property editor
T1. Title

When the title is set to “auto”, the title is autogenerated based on the dimensions and metric you use for the analysis or visualization Example:

Custom Title: Just type whatever you want the title to be.
2. Size
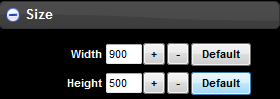
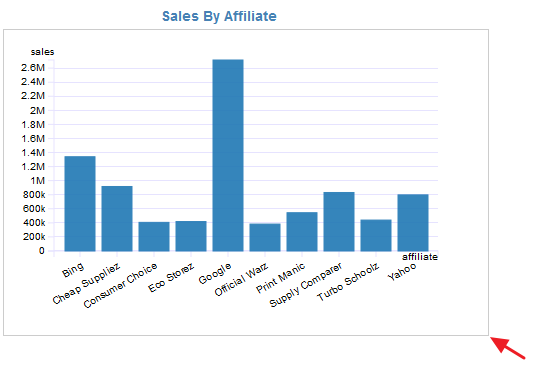
This controls the width and height of each visualization. There is a much easier way to control the dimensions of the charts. When you see the chart rendered, the first chart in the trellis has a re-sizable border that you can drag to control the dimensions. Drag the corner to change the width and/or height
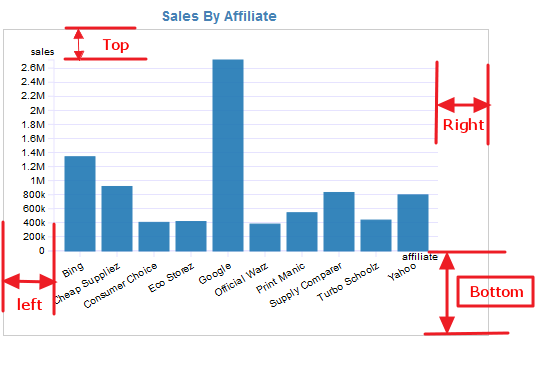
3. Margin
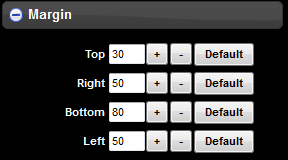
This controls the space around the chart.
4. Axis
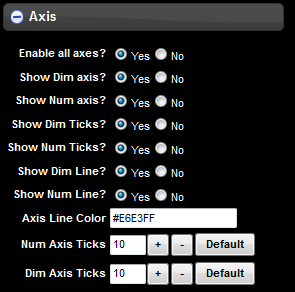
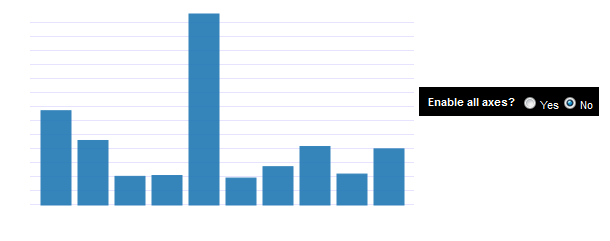
4.a Enable all axes:
This is a quick way to disable or enable all axes including the names, tick marks and axis data labels.
4.b Show Dim axis:
This property is ignored if “Enable all axis” is “No”. The property 4.a is like a master switch.By setting “Show Dim axis” : Yes/No you can individually control its visibility
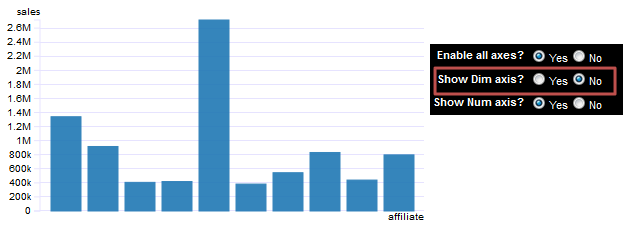
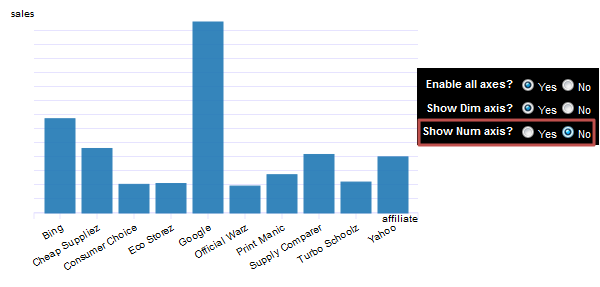
In the above example, Dim axis is turned off but the number axis is kept on. 4.c Show Num axis: This property is similar to 4.b Show Dim axis but works on the number axis.
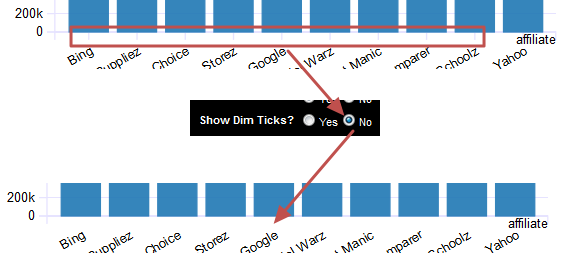
4.d Show Dim Ticks:
4.e Show Num Ticks:

4.f Show Dim Line:
This will turn on/off the horizontal line for the dimension axis
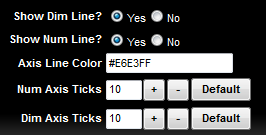
4.g Show Num Line:
This will turn on/off the vertical line for the number axis 4.h Axis Line Color: This is the hex color code for the axis lines. 5 Labels
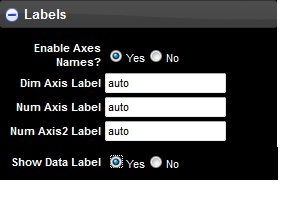
5.a Enable Axes Names:
This will turn on/off the label display for each Axes.
5.b Dim Axis Label:
If it is set to “auto” then the lowest column dimension is used as the label. You can type any custom string. If you want to show a blank label then simply type a blank character.
5.c Num Axis Label:
This works same as Dim Axis label [5.c] but for the number axis
5.d Num Axis2 Label:
This is specially for the Dual Bar Line chart and the label for the second number axis
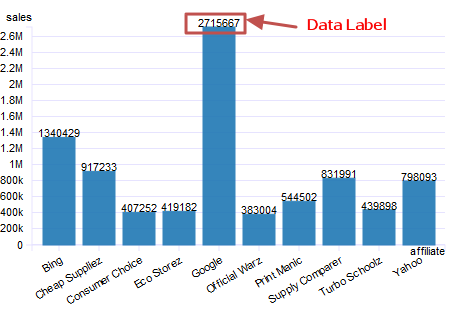
5.e Show Data Label:
This shows the labels within the chart for each data element.
6 Miscellaneous
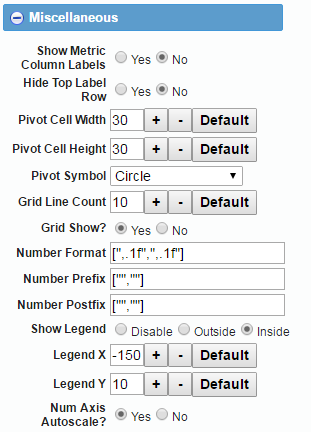
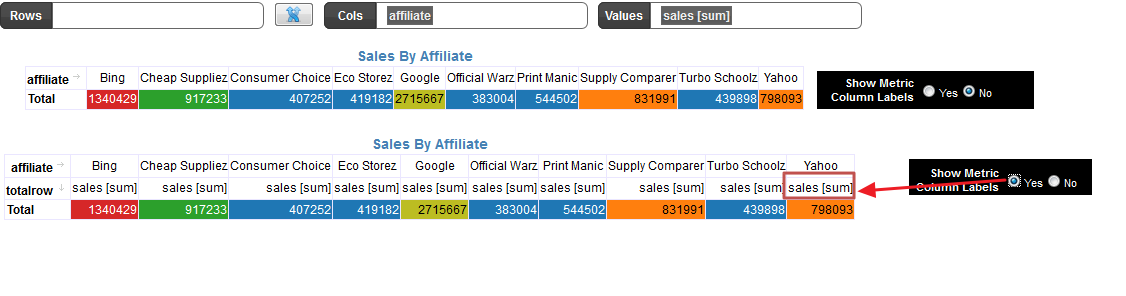
6.a Show Metric Column Labels:
This can turn on/off the column metric labels during the Pivot display.
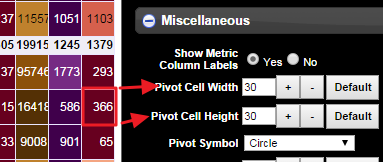
6.b Pivot Cell Width:
This controls the cell width in the Pivot visualizations 6.c Pivot Cell Height: This controls the cell height in the pivot visualizations
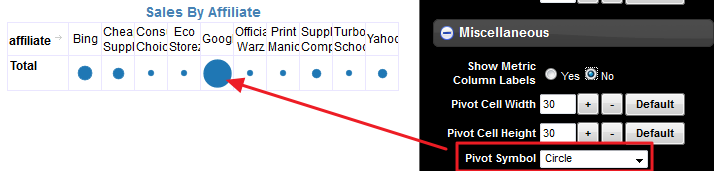
6.d Pivot Symbol:
This is the symbol used during the “Symbol Pivot” visualization
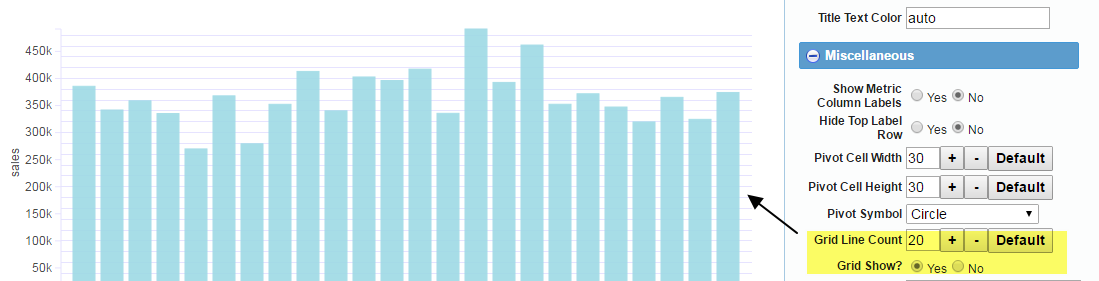
6.e Grid Show:
Yes will show the background reference lines for the chart. A value of No will turn them off.Grid Line Count: will show the lines in multiple of 5 or 10.
6.f Number Format :
Controls the numeric formatting for the pivot table. Each value in the array controls the metric assigned in the value bucket
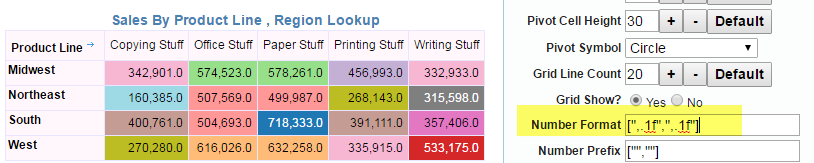
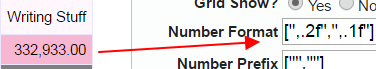
Different formatters are based on d3 plugin
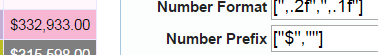
6.g Number Prefix:
You can supply a currency symbol
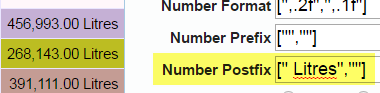
6.h Number Postfix:
Similar to prefix you can supply any character like %
6.i Show Legend:
Legend is the list of values that is displayed on the chart.
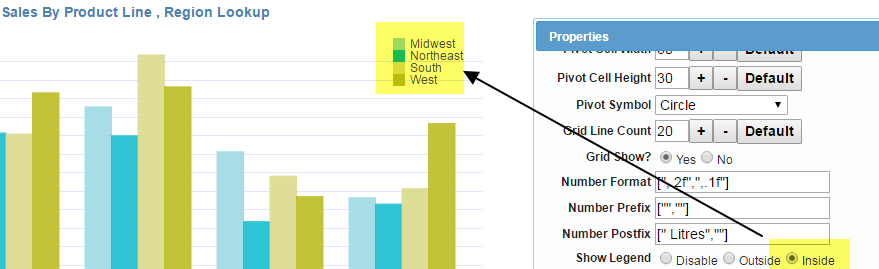
Value of inside will show it within the chart Value of Outside will show it outside the chart on the very left side.
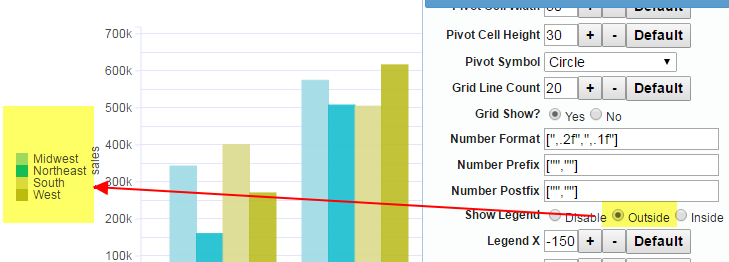
Value of Disable will not display any legend. Usually if there is only one value in legend then it should be disabled. Legend X and Legend Y: These two properties control the position of the legend when you select Show Legend=Inside
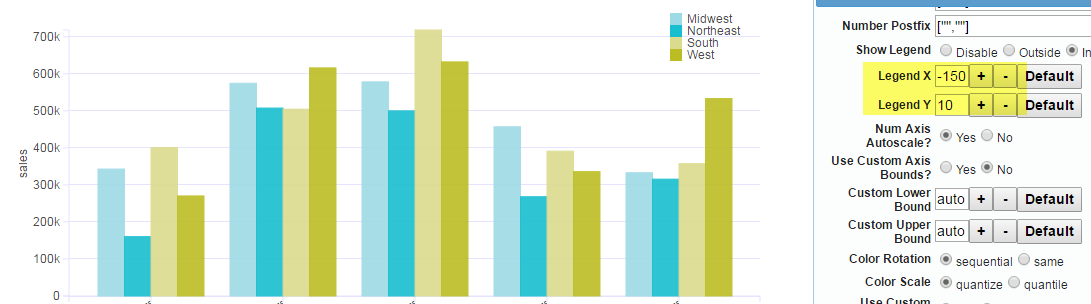
The Legend X takes a negative value and it is relative to the right boundary of the chart. Num Axis Autoscale: This property can be explained by the following examples When Autoscale = ‘Yes’ then each split chart scales to its own max Y value
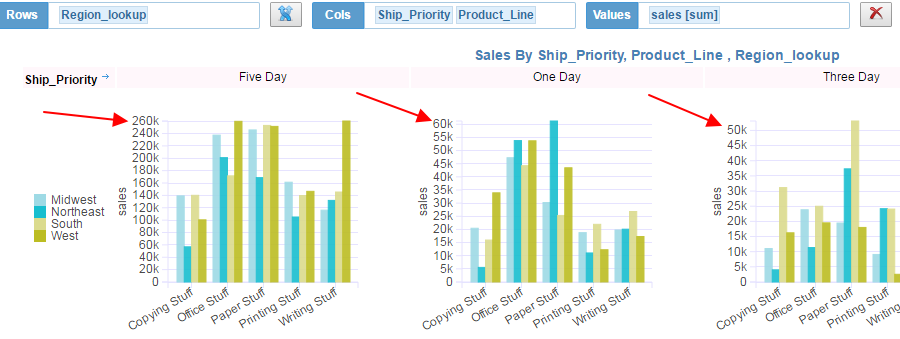
In the above chart, we have one dimension under “Rows” and two dimensions under “Cols”. The dimension ship priority causes the chart to split horizontally.Notice the Y axis (number axis) for each chart. They have different max values because they automatically scale to their own max value within the ship_priority value. Now check the same chart with Autoscale=”No”
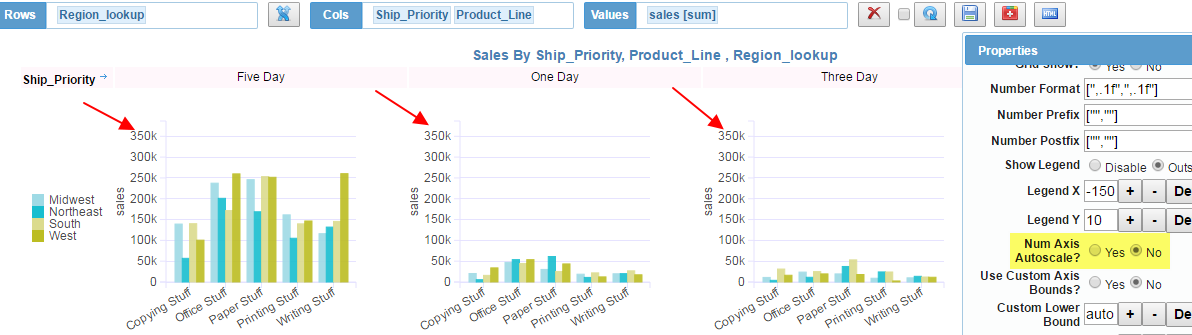
Now each sub-chart is set to the max value of the entire data set. This gives a better comparison view across all ship priority values.