
InfoCaptor Enterprise takes dashboarding to a whole new level. Besides providing a unique and innovative approach to building dashboards it has included elements of game design into the dashboards. To understand the important of these “Bells and Whistles”, let us understand the importance of dashboards.
Importance of Dashboards
- To refine your data and provide pure information in gold
- This information gives a birds eye view of your business
- Once you get an overview it should instill an action
- This action could be to
- Motivate
- Discover patterns to Increase revenue
- Discover holes to reduce operating cost
- Simply have fun with your business.
InfoCaptor has merged the elements of Business Intelligence Visualizations and fun elements of Game Design to bring a whole new “Out of the box” thinking. Examples
- What if a dashboard widget played a sound whenever a new user signs up?
- Wouldn’t this give you an extra boost in your motivation
- Let say you are monitoring important networks and one of the website went down
- Show the widget representing the website go deep “Red” in color
- If that is not enough to catch attention, you can apply motion effect and create a visual disturbance
- If that does not work and want to instill a fire drill kind of action just play this “air raid attack” sound
- If your staff is on vacation then send an Email Alert
Data Capture / Post arrival
Data processing InfoCaptor provides complete control on the data once it arrives at the widget to display. When do you have access to data?
Here is a typical data flow
1. Widget fires the query (SQL or webservice) to the server
2. The server processes and returns the data (JSON, text etc)
3. The data in JSON format arrives at the widget for display purpose.
At this juncture you can optionally
3.a) define a custom Javascript that intercepts the data and takes necessary actions (motion, visual, sound or email alerts)
3.b) display data on the widget (icon, widget,grid, charts).
So when you define a data source, you have the option to define a snippet of javascript code which is very easy to understand for basic stuff.
You have complete access to this data and you can literally do anything with it.
Example
- Check existing data and compare with new incoming data
- Add your own colors to it
- Fire animation routine
- Play a sound
- and you could change the data itself (not recommended)
Define your Post arrival Data Processing Steps Right click on any widget
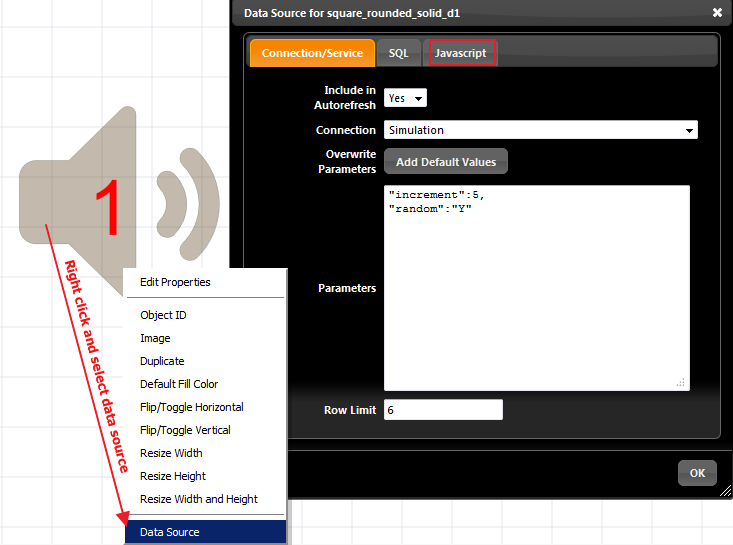
In the above example, the icon is using the simulation service and it is just a random number counter In the Editor, there is a tab “Javascript” Click on the tab
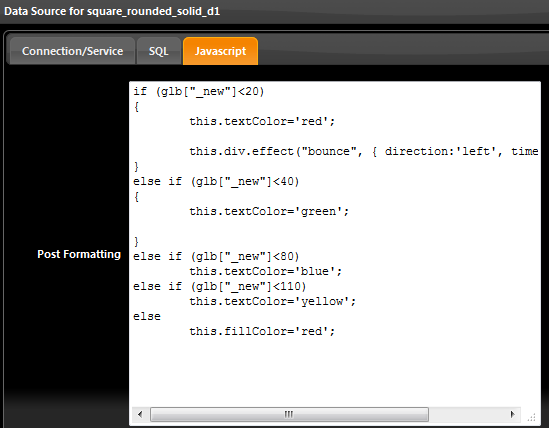
Here is the complete javascript snippet. Before we go into the javascript let us understand the data array and variables Standard Data Variables
All the data is contained in the “glb” array which is short for “global”
No matter how the data arrives at the InfoCaptor server, the server converts and transforms the data to a JSON object before sending to the Dashboard Data when it arrives to the “widget” is always in JSON.
Example JSON object Alexa (represented in a simple box widget)
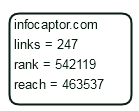
JSON ={“legends”:[“metrics”,”infocaptor.com”],”data“:[[“links”,”rank”,”reach”],[“247″,”542119″,”463537″]],”id_list”:[“infocaptor.com”],”service_name”:”alexa_all”,”type”:”SERVICE”}
- glb[“_json”]= This is the complete JSON object as detailed in the API (This contains the full object including legends and data)
- glb[“_odata”]= This is only the data portion of the above JSON (The above data node in the json)
- glb[“_curr”]=The current value in the Widget ( in the case above, it would be the complete text string [infocaptor.com ..links = 247 .. ]
- glb[“_new”]=JSON.data[0][0]; (This contains only the first element of the data array) This is meant only as a shortcut in case of icons and single value widget
In summary you can do pretty much anything with just the parent JSON array
i.e glb[“_json”]
If you are using a Grid that contains multi cell data, it makes sense to use the glb[“_odata”] array
If you are using say a icon for countdown or simulation or display single value you can use glb[“_new”]
glb[“_curr”] is the current data that you see in the icon/widget/chart. This string or text data is exactly same as what you see in prototype mode.
So if you plan to compare data against the current value, you will need to strip out newline characters and check how the string is structured. You have access to the above JSON data array and variables in the javascript section and this is what we can use to create the various motion, visual and sound effects as illustrated in the following sections