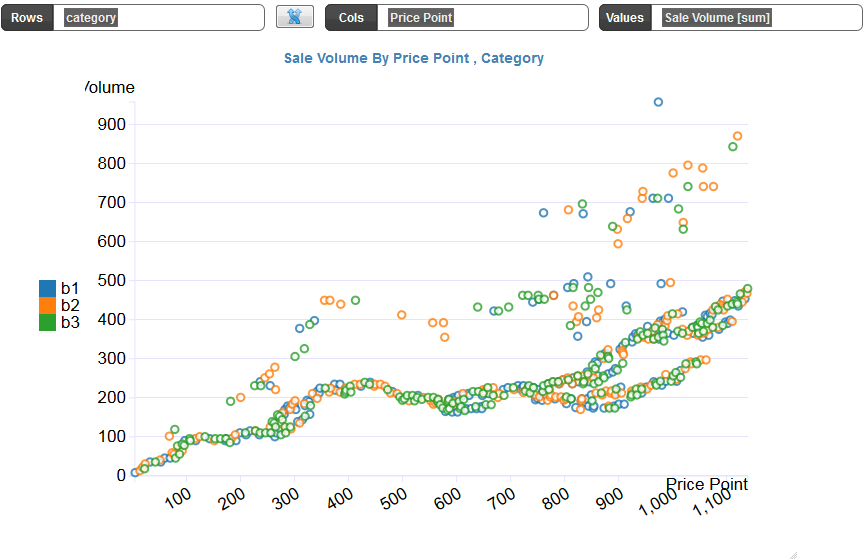
In Scatter plot, the data is displayed as a collection of points, each having the value of one variable determining the position on the horizontal axis and the value of the other variable determining the position on the vertical axis.
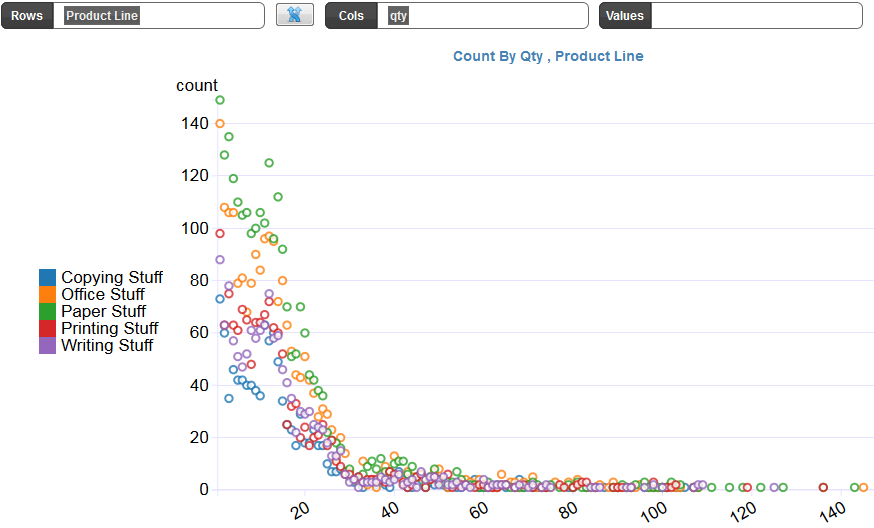
For scatter plots, the Columns bucket is usually a numeric value. Another example