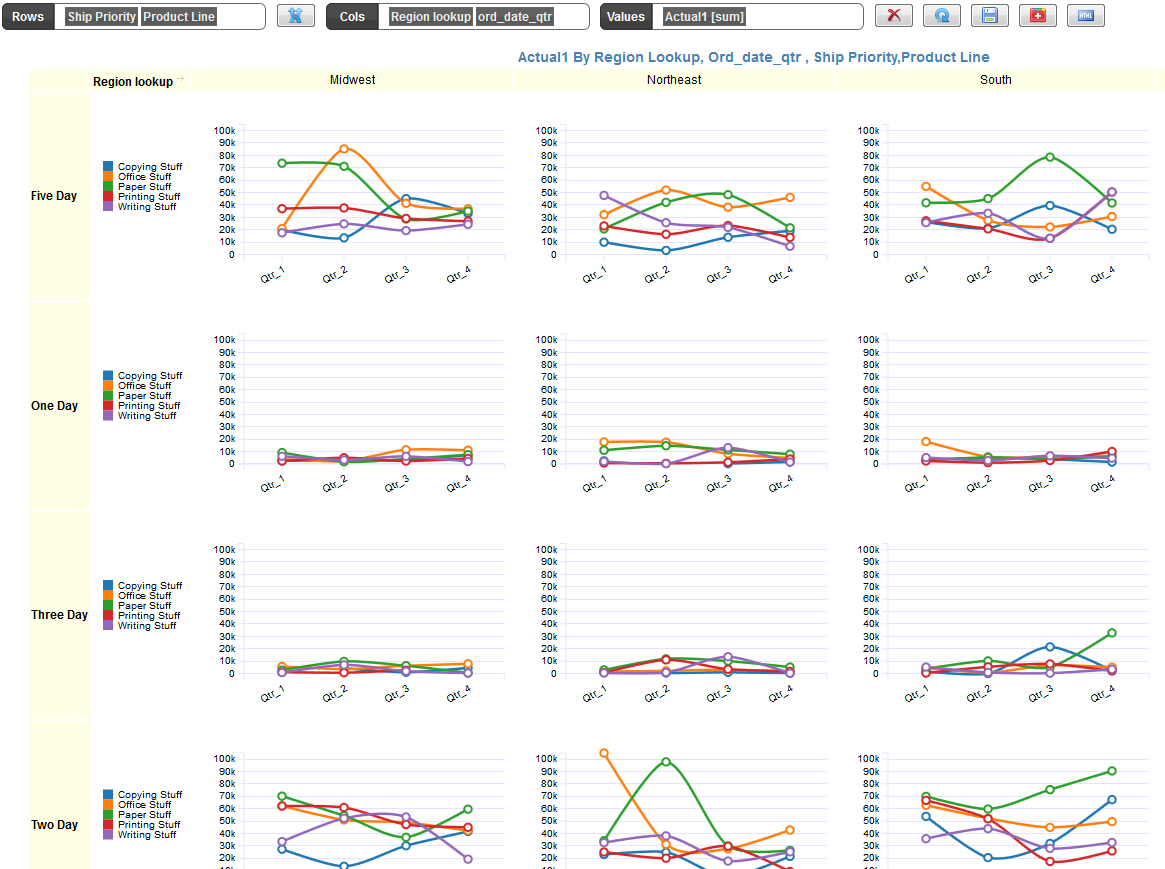
A line chart is often used to visualize a trend in data over intervals of time. But you are not restricted to just base it on the time dimension. Just like Bar charts you can use any dimension or measure for your X-Axis.
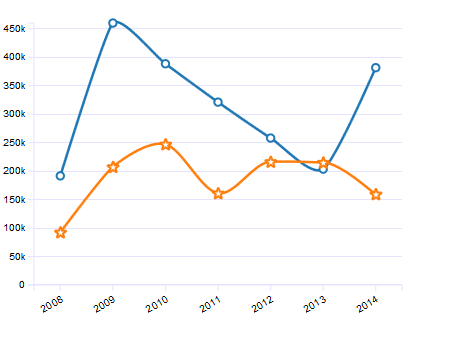
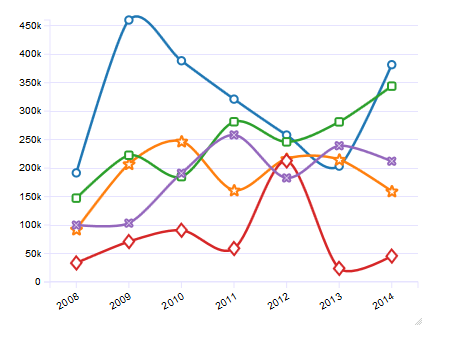
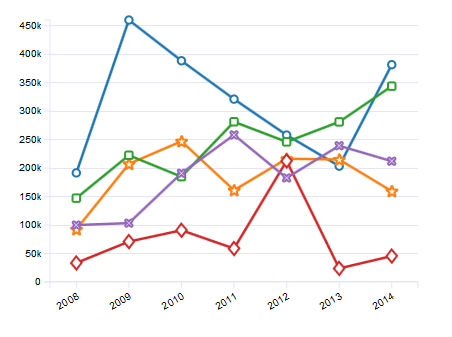
Here is a basic line chart with different Marker styles.

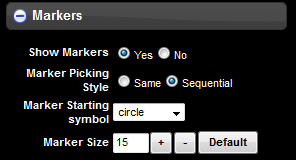
You can define the marker properties
InfoCaptor provides various kinds of line charts.
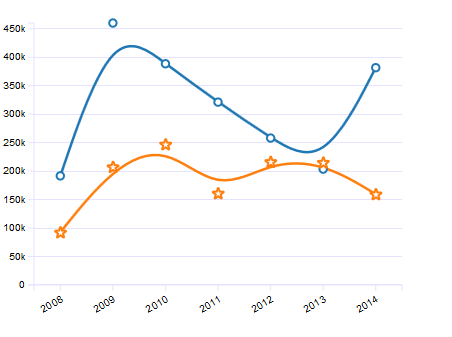
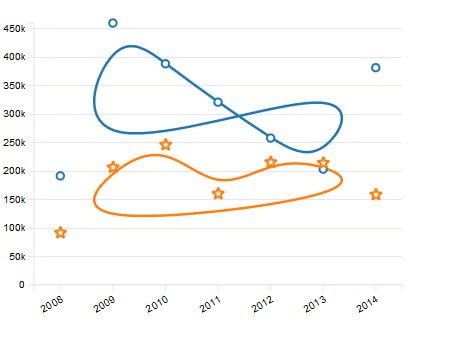
1. Spline
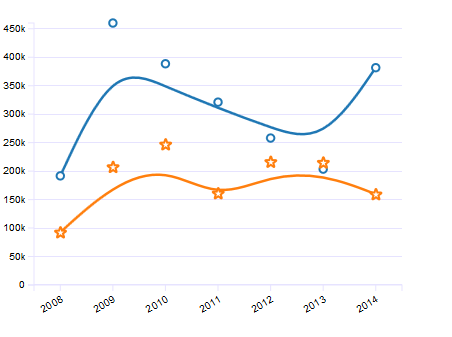
2. Normal
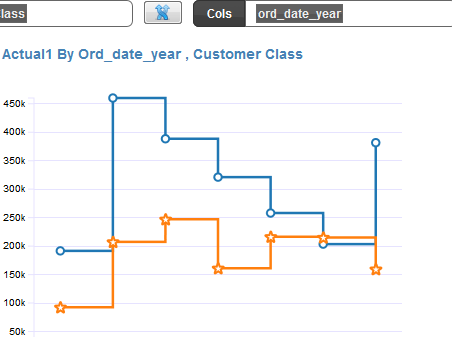
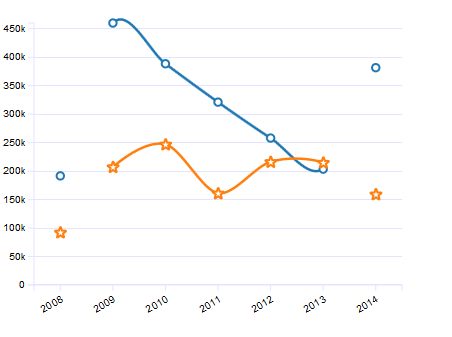
3. Step before
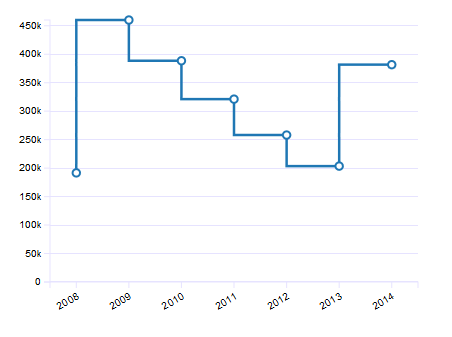
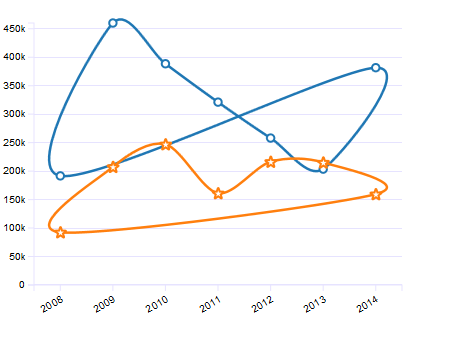
4. Step after
5. Basis interpolation
6. Basis Open Interpolation

7. Basis Closed Interpolation
8. Bundle interpolation
9. Cardinal Open interpolation
10. Cardinal Close interpolation
11. Monotone