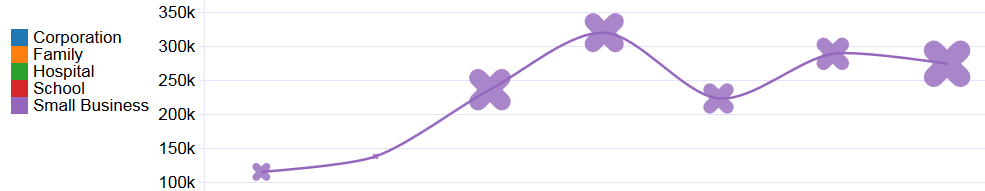
Bubble + line is simply a combination of the Bubble chart and the line chart This chart helps in understanding the trend in the first metric
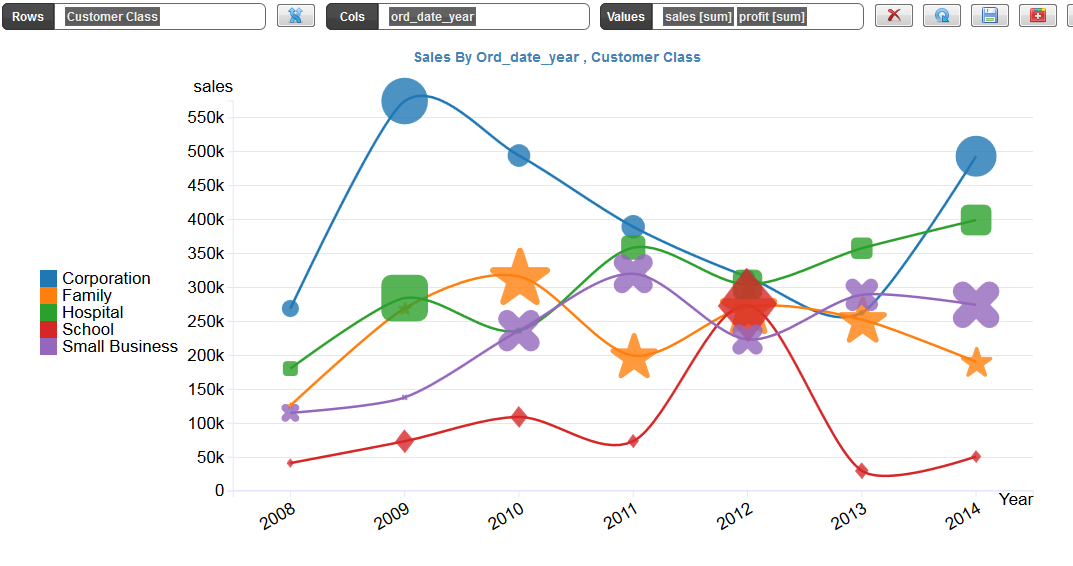
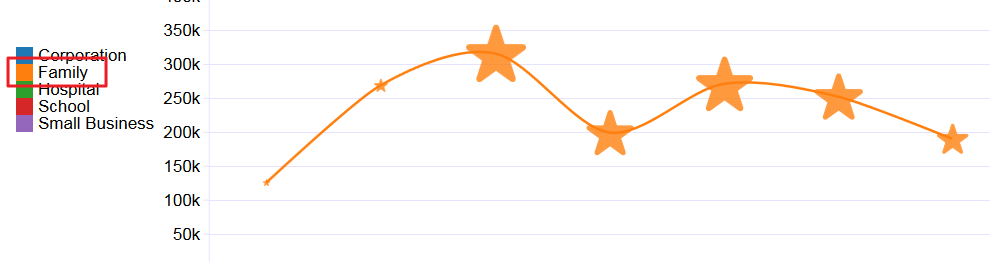
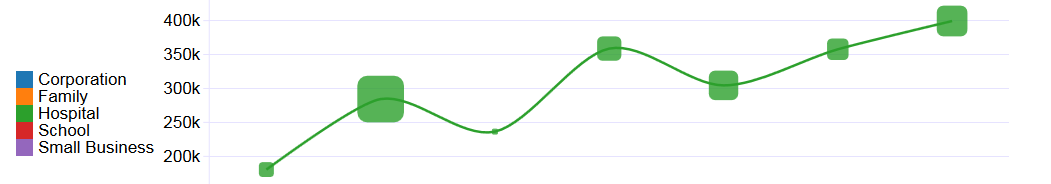
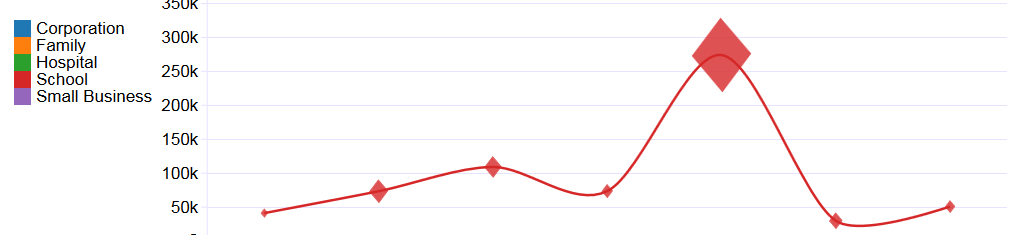
You can click on the individual legends and see the individual trend and the profit ranges


Bubble + line is simply a combination of the Bubble chart and the line chart This chart helps in understanding the trend in the first metric
You can click on the individual legends and see the individual trend and the profit ranges