Drilling down into details is a fundamental aspect of any Business intelligence application. InfoCaptor provides good drill down options.
- You can drill down from one widget to another
- You can drill down from one widget to multiple widgets
- You can drill down from Grid to charts
- You can drill down from one chart to another chart
- You can drill down to a totally different dashboard
- You can drill down to external third party applications
Before moving further it would help if you could familiarize yourself with how the dashboard prompts/filters work. In summary
- Every dashboard prompt can broadcast the change in value to all the listening widgets
- The listening widgets can consume the value in their respective SQL and provide new data set
So in the same manner, when the user clicks on any non html control, say for e.g inside a Grid cell, then multiple grid channels are created. The number of channels for each gridis same as the number of displayed columns. So each column in the grid represents a unique channel.
There are three properties that control the drilling actions
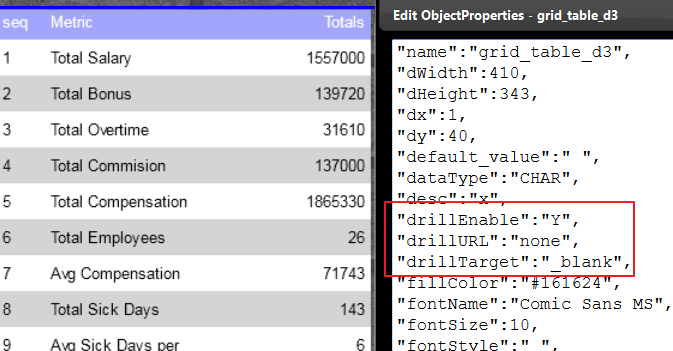
- drillEnable
- drillURL
- drillTarget
1. drillEnable
By default this property is set to ‘N’ that is the disabled option. It has to be a conscious design decision whether to enable drill down action on any widget. One reason is performance. When the property is set to ‘Y’ then every click triggers background processing. So enable this flag only if you wish to drill down into details from here. When you set to ‘N’ then the corresponding channels do not contain any information.
2. drillURL
: The default value is “none”. When it is set to none then the drill down action is limited on the same dashboard.
If you set it to any URL say http://www.yahoo.com or another dashboard URL say “https://my.infocaptor.com/dash/mt.php?pa=finance_dashboard_4fb0659a8a737” then all the channels values are passed on as GET values on the URL.
The GET name is the dashboard filter name and the value is the current value in it.
In the receiving dashboard, all the GET variables are used to set default values if the target dashboard contains html controls with same filter/channel names.
3. drillTarget
This will be popup window’s name when you provide a drilling URL. setting it to ‘_blank’ always opens up in new window (in most of the browsers)
Drill from Grid The action of clicking on any cell inside the grid, broadcasts new values to these channels. Now any other widget that is listening to these channels will get the new values.
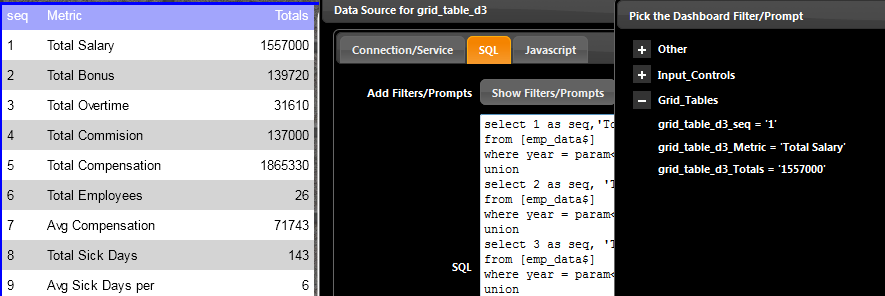
In the above screenshot, when you click on the first row, then the channels grid_table_d3_seq, grid_table_d3_Metric and _totals will contain the latest values.
These are available in the Dashboard Filter/Prompt on the SQL tab. For the listening widgets it does not matter who is sending the new values whether it is a select/combobox or a Grid table. This is the basic Drill through action.
Drill from Charts
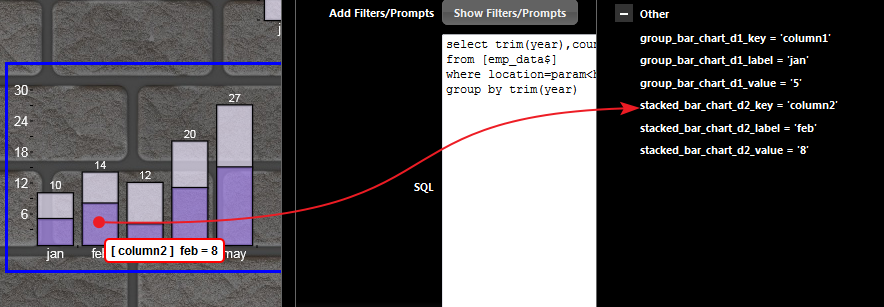
The click on any chart creates three specific channels
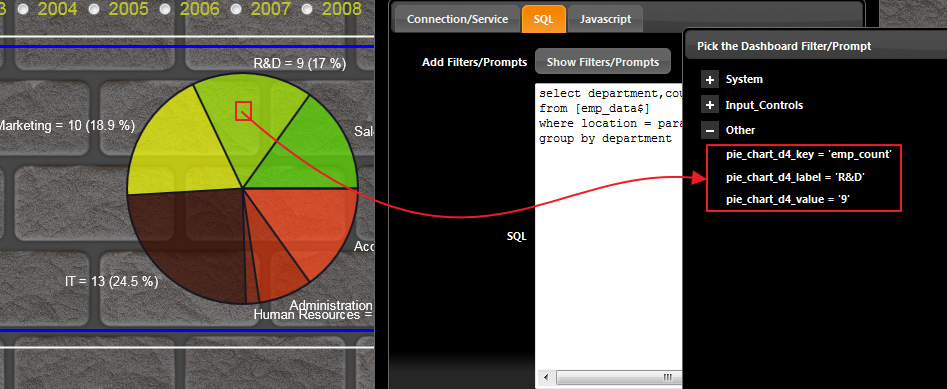
for e.g when you click on say the “R&D” slice of the pie chart, then it adds three channels that can be used in the drill through action. The typical usage would be to simply use the _label channel in the SQL filter condition in the target data widget to show more details on the “R&D” numbers. Same is true for clicking on a bar chart
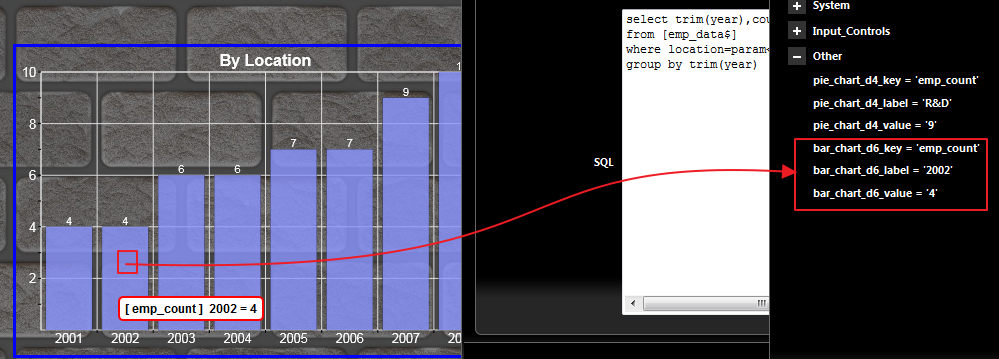
The click action works on all the chart widgets. Group Bar chart click action

In the group bar chart, the “key” channel will give you which column the user clicked on and the label will give you which group the user clicked on. The group bar chart is created when you send two independent columns of values. These independent columns are represented by the “keys” and so clicking on each bar in the group gives you either column1 or column2.
NOTE: column1 is simply the name we gave in our data set. If you provide a different name for column then that will be used as the key.
Stacked Bar chart
Line Chart

