
What properties can you manipulate
Each widget contains a set of properties that you can directly manipulate.
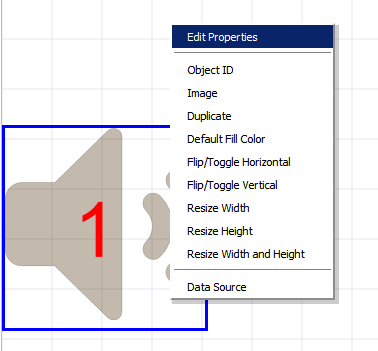
Right click on the widget and select “Edit Properties” It shows the available properties
- “dWidth”:200, [change the width of the object]
- “dHeight”:200, [change the height]
- “dx”:0, [change the x location]
- “dy”:186, [change the y location]
- “fillColor”:”#533813″, [change the fill color]
- “fontName”:”default”, [change the font name – this is disabled]
- “fontSize”:57, [change the font size]
- “fontStyle”:” “, [change the font style – not needed, manipulate through showBold, showItalic etc]
- “horizCellPadding”:10, [change cell padding]
- “horizObjectPadding”:15, [change overall padding]
- “lineColor”:”default”, [change line color]
- “lineWidth”:1, [change line width]
- “margin”:5, [change margin]
- “opactiy”:0.4, [change transparency]
- “showBackground”:true,
- “showBold”:false,
- “showBorder”:false,
- “showItalic”:false,
- “showStrike”:false,
- “showUnderline”:false,
- “textBackgroundColor”:”none”,
- “textColor”:”red”,
- “textHorizAlign”:”center”,
- “textX”:-10, [change the relative position of text X location in icons]
- “textY”:0,
- “vertObjectPadding”:10,
- “zIndex”:-1,
- “showTextShadow”:false,
- “textShadowOffsetX”:0,
- “textShadowOffsetY”:0,
- “textShadowBlur”:0,
- “textShadowColor”:”white”,
- “showBoxShadow”:true,
- “boxShadowOffsetX”:0,
- “boxShadowOffsetY”:0,
- “boxShadowBlur”:0,
- “boxShadowColor”:”white”
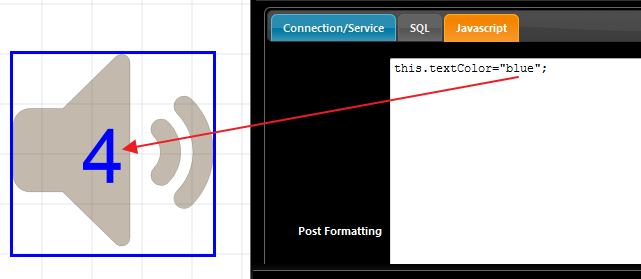
You can access the widget’s properties using the “this” operator
for e.g in the javascript if you simply say
this.textColor=”blue”; // property # 22 above
then upon the first refresh the text will go red and stay that way until you add another logic
Note, in the designer even though you can change the font settings and cosmetics, the difference right now is that you are doing it programmatically and at run time when the data refresh occurs.
So this is powerful stuff. When your data is refreshed and depending or independent of your data, You can do the following
- change the position of the widget
- change text color
- change text size
- change size of the widget
Heat Map Style Grid Consider this simple MySQL based Grid data
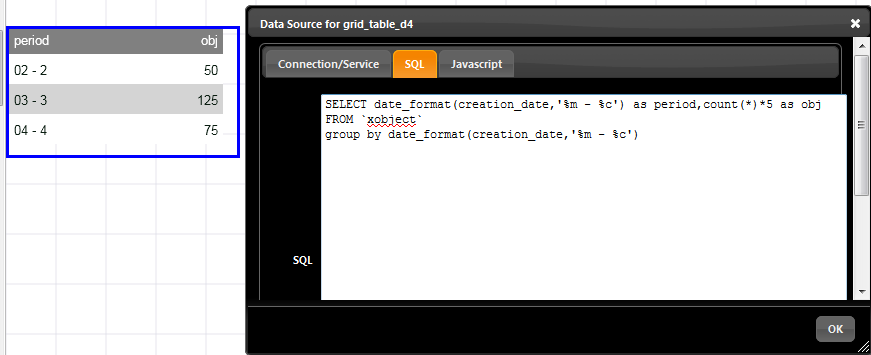
It is a two column grid. Let us add some javascript. Before we move further familiarize with how the data arrives and which arrays are available for reference
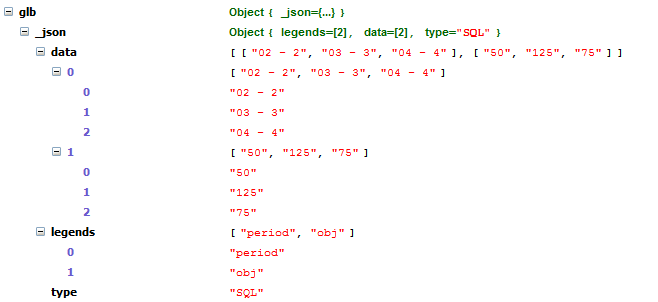
The “glb” is a global array containing the latest data for the current widget. The data arrives in separate columns. First column is data[0] and second column is data[1] Having this array gives us full control so let us try to change the colors of the data that arrives But before doing something ambitious, let us simply change the data in the first column. We will add a simple javascript
- var cols=glb[“_odata”].length;
- var rows=glb[“_odata”][0].length;
- for (var i=0; i < rows; i++)
- {
- glb[“_odata”][0][i] = glb[“_odata”][0][i] +”x”;
- }
In the first line we collect the number of columns, remember the variable glb[“_odata”] is a 2 dimensional array, first the columns and second the elements in the column In the second line, we get the number of rows by just checking the length of the first column Next we have a for loop to go through each element and simple append a “x” to the data. So effectively we did the most dangerous thing, changed incoming data. Here is how our new grid looks
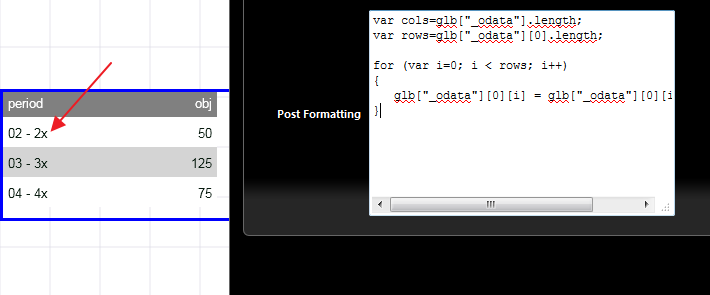
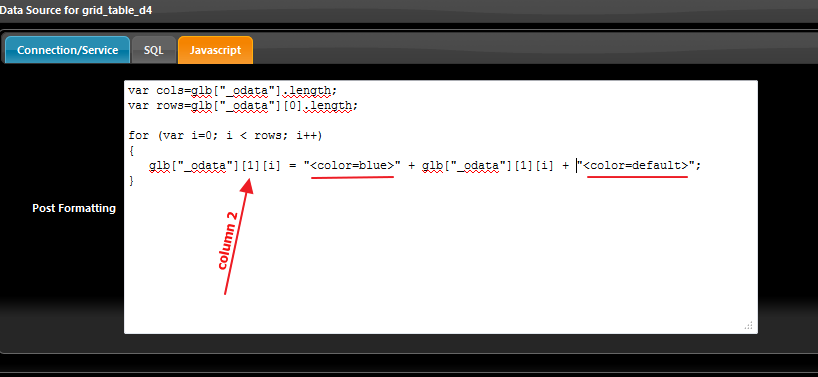
Note the x at the end of the period column data Now let us modify a little bit to change colors only for the obj column
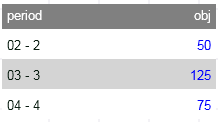
The result is
var cols=glb["_odata"].length;
var rows=glb["_odata"][0].length;

for (var i=0; i < rows; i++)
{
  glb["_odata"][1][i] = "<color=blue>"+glb["_odata"][1][i] +"<color=default>";
}


Note that we change the column from 0 to 1 and we encapsulate our data with two color tags.

What fun is to change color for all data

Let us add one more condition to change the color only if it is above 50 to red

var cols=glb["_odata"].length;
var rows=glb["_odata"][0].length;

for (var i=0; i < rows; i++)
{
  if (glb["_odata"][1][i]>50)
  {
    glb["_odata"][1][i] = "<color=red>"+glb["_odata"][1][i] +"<color=default>";
  }
}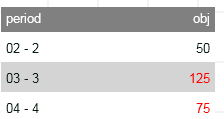
So using same approach you can pretty much do anything with the incoming data.
Moving objects around
Even though you have direct access to the dx and dy properties, you should use the following methods
Below is an example where three icons are pitted against each other for a random number race
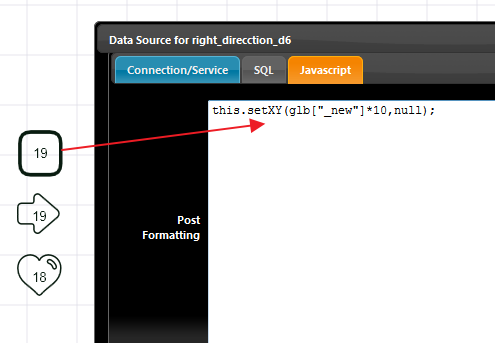
So when the new value arrives the position of the icon is set to new value depending on what the value is Same for the other two icons. The Parameters for the above icons are

Functions
setXY(x,y) : This just positions to the new position
objectmove(x,y) : This adds to the existing postion.
For e.g if you passed objectmove(10,0) then it will move the object 10 pixels along X and keep the y position same.