Publish analysis as Static HTML. This is a very handy option to instantly publish any visualization into a static HTML page. After publishing it generates a unique URL that you can use to email it to anybody. The visualization is static in the sense there is no tool tips or interaction (this may change in future releases).
NOTE: This feature requires a special license
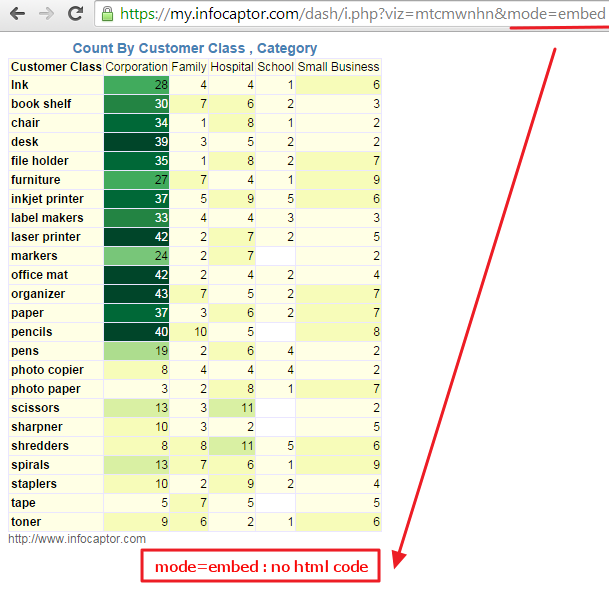
For quick review and prototyping, you may choose to publish the visualization into a Static HTML page. You can also choose to publish the visualization to a dashboard and generate a static HTML output. Once you click this button, it generates an URL as shown below. As you can see it generates a unique URL for each combination of your dataset, rows , columns and metric values.If you change or move your dimension between rows and columns bucket then the URL will be totally different.
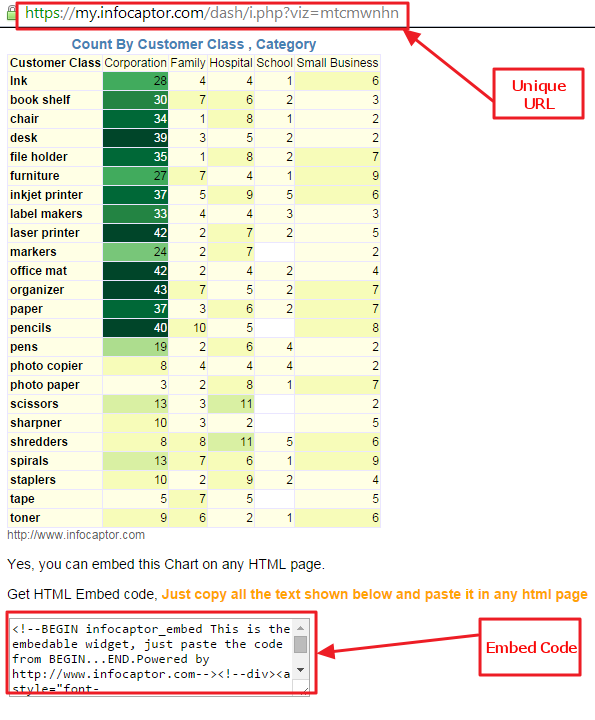
At the bottom of this page, you can also find the handy HTML code that can be copied straight into any HTML page or a web portal. This code will not be displayed once you embed it in any other web page. Alternatively if you do not want to see this embed code then simply append “&mode=embed” at the end of the URL