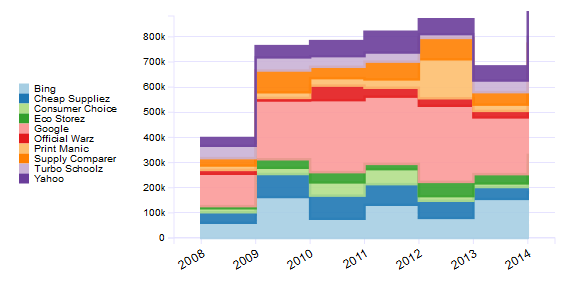
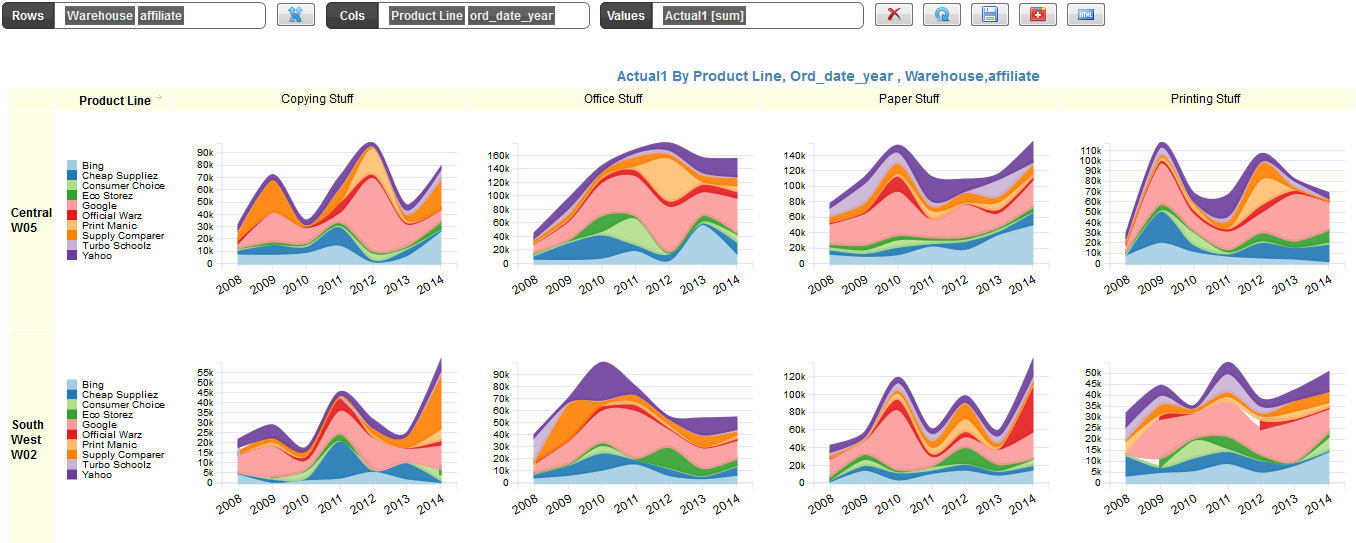
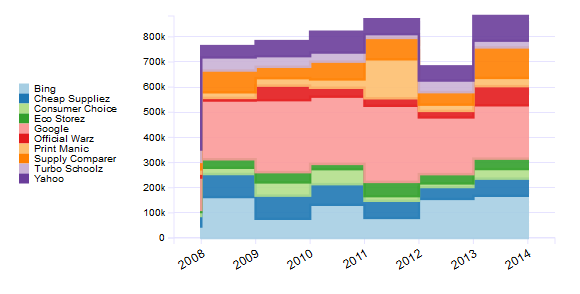
Very similar to line and bar charts, area charts are used to represent cumulative totals using numbers over time. Use the area chart for showing trends over time among related attributes.
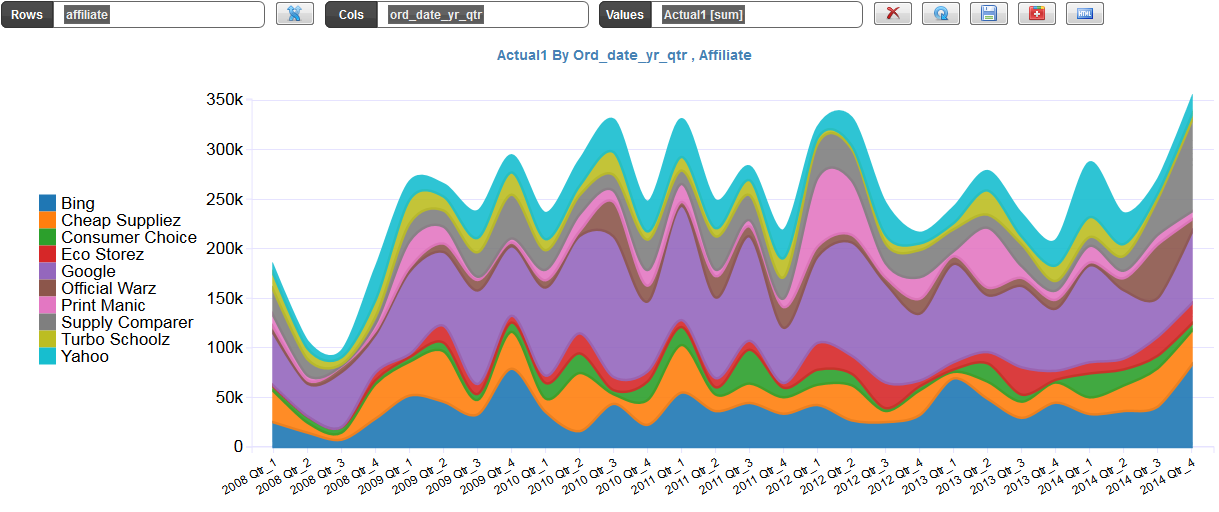
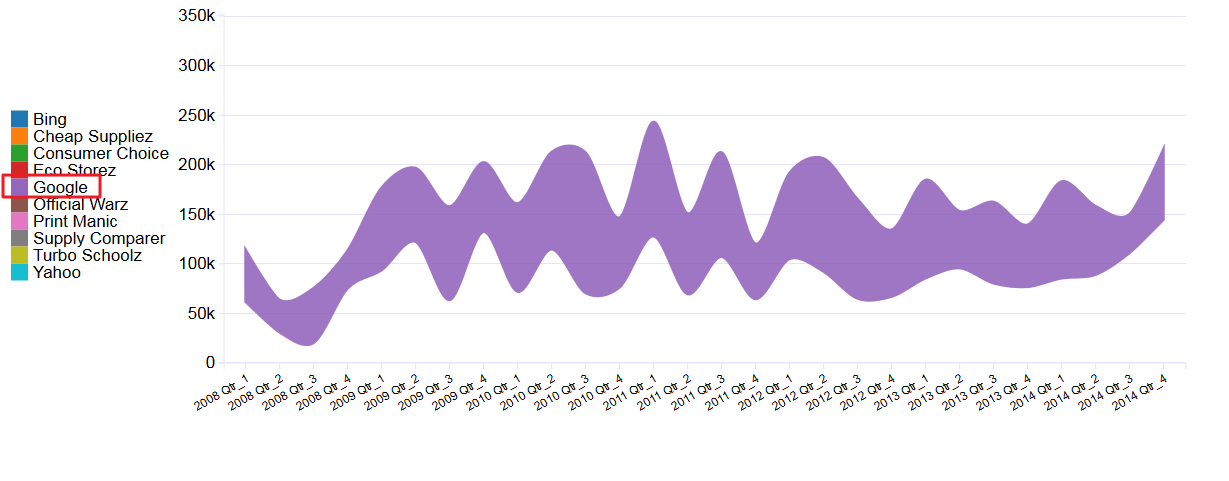
Sometimes they are also referred to as stream graphs.If you click on the legends on the left you can see the individual streams
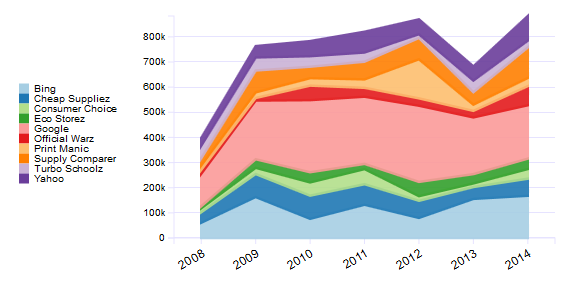
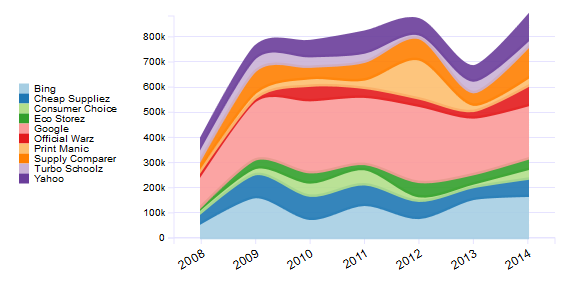
There are other different Area charts as illustrated
1. Regular Area Chart
2. Spline Area Chart
3. Step before
4. Step After