
Let us take a look at the Editor Tab within InfoCaptor
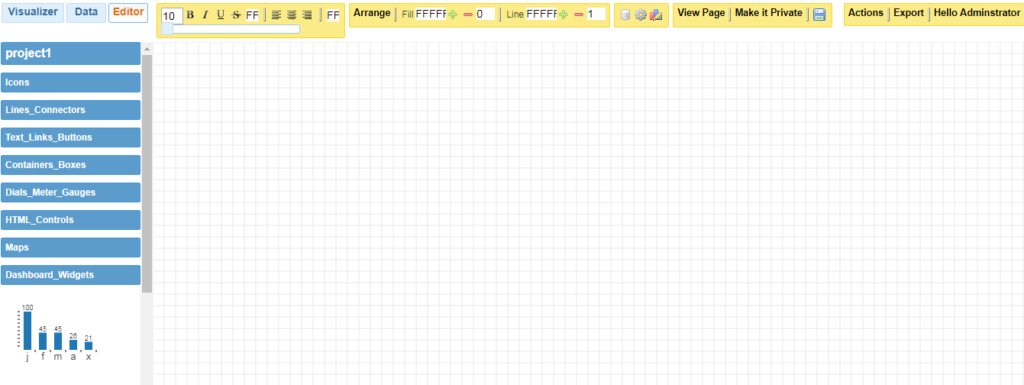
On the left side you will see the top section contains the projects and pages under that.
Below that you will see various widgets. These widgets can be easily dragged into the center canvas (where the grid is).
In the very initial version of InfoCaptor, there was no concept of Data Tab or Visualizer Tabs. These were added in later versions. Early on, the dashboard Editor tab was the only way to build dashboards.
In the editor, you can drag the widgets and right click on the widgets to define the data source and the SQL query. Every widget allows to provide a SQL query to source data from.
Later when the Data Tab and Visualizer were introduced the process of building dashboards became more streamlined.
This is a typical flow of Dashboard making process
- You start with Data Tab
- Select the data source you wish to work with
- The data is brought into the Visual Analyzer Tab
- You build your analysis and charts in Visualizer
- Once you are happy, you push the analysis to the Editor Tab
- Within Editor Tab, the analysis is pushed to the currently selected dashboard page.