[Section A]
Every dataset is divided into dimensions and measures. All non-numeric fields are automatically tagged as dimensions. All numeric fields are put in the measures. InfoCaptor looks at the first row of dataset and tries to understand the type of data contained in each field. It is possible for numeric fields to end up in the dimensions. We can drag fields from Dimensions into Measures and vice-versa as shown below
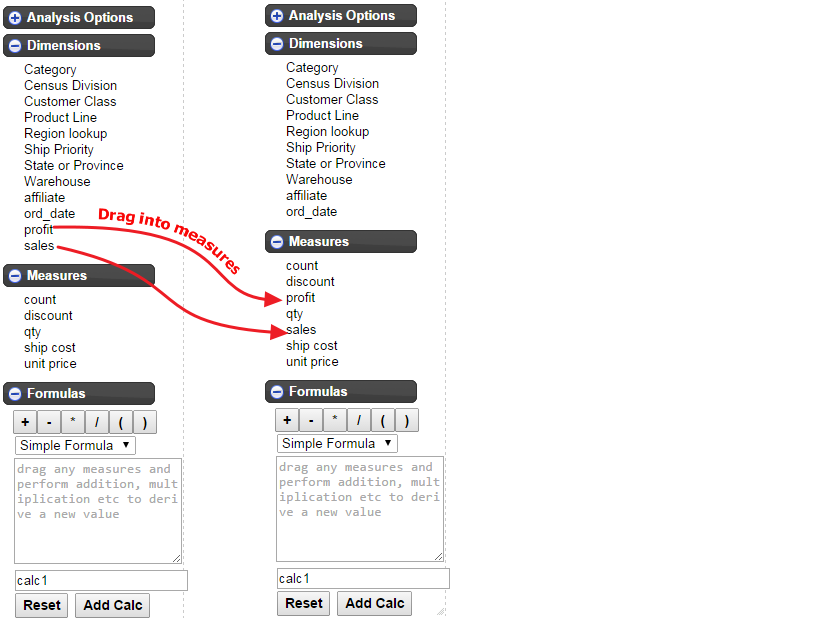
Example: Sales and Profit are number fields but since they have a comma in the data
the fields are put in Dimensions. So we simply drag and bring them into measures.
[Section B]
Filtering Datasets
InfoCaptor provides excellent mechanism for filtering datasets and it works consistently acros entire application irrespective of the data source.
[B.1] Filtering directly within Analysis
We can right click on the row or column labels and we can instantly either Exclude that dimension member value or choose to just keep that member value. If you exclude then it removes the row or column corresponding to that member and if you say ‘Just keep’ then it excludes the rest of the members and keeps only that member value
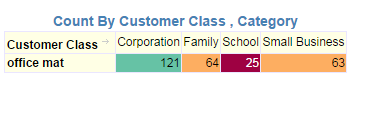
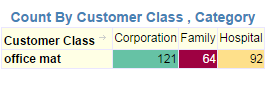
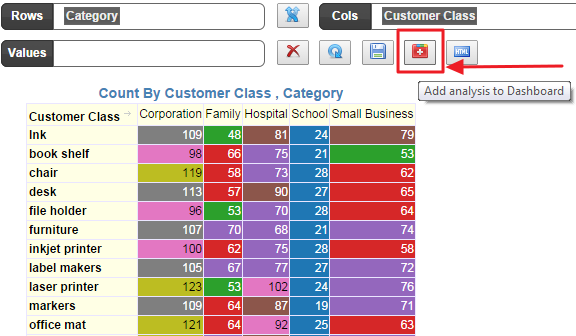
Let say you have the below analysis
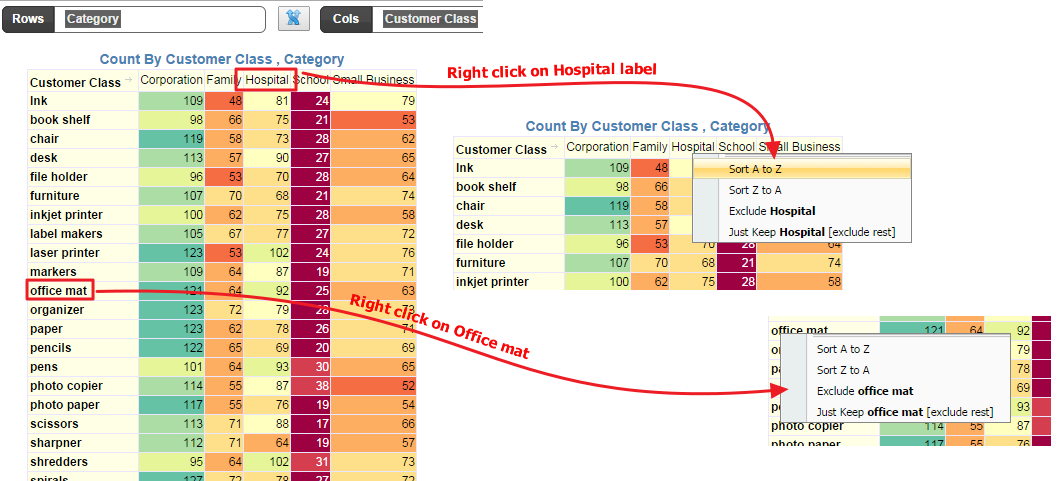
If we decide to exclude Hospital column from the analysis, we right click on the hospital label and then select ‘Exclude Hospital’
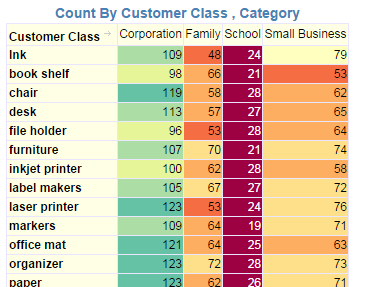
Now we will right click on ‘Office mat’ and use ‘Just keep’ filter
You can keep repeating this operation on other dimension members and it will keep adding to the filter list.
[B.2] Editing the Filters
You can see the current active filters by expanding the ‘Analysis Options’ node
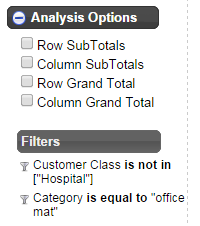
You can see the two filters that we defined. Let us exclude one more column member
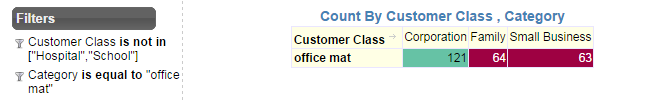
Notice, the filter now says “Customer Class is not in [“Hospital”,”School”]
You can edit the filter directly for more refined control
Right click on the filter and select ‘Edit Filter’
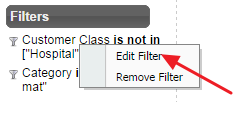
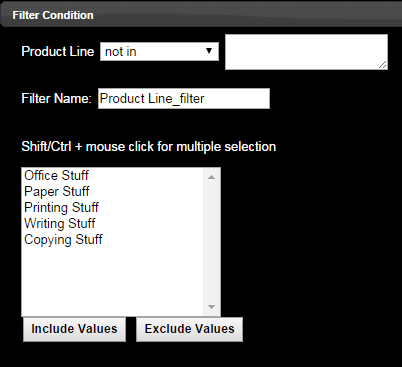
It shows the Filter Editor
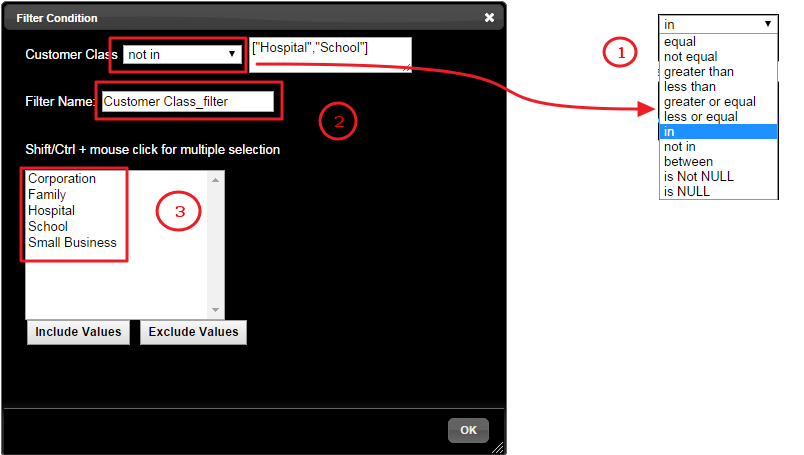
The drop down shows the list of filters you can apply
- The default name of the filter
- List of unique or distinct values contained in the dimension member
Now let us try few options.
- We can select values by pressing Shift or CTRL+ mouse click
- We can click on either Include Values or Exclude values.
- After clicking Include Values, the filter changes to ‘in’ and the values are also updated.
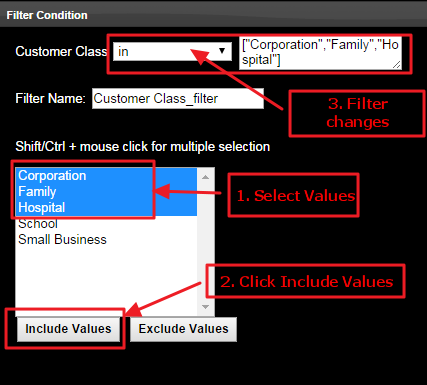
Click OK and the analysis will update accordingly
The filter window stays open after clicking OK, so you can move it to the right to play with different options and see the live changes in the analysis.
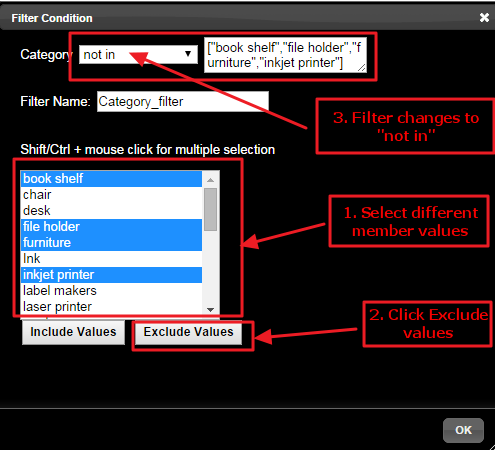
Close the filter window and now we will change the second filter for Category
[B.3] Add new filters from Dimensions
In the above sections we were able to apply filters on the fields that are already part of the analysis. Similarly we can apply the filters on the other dimension members that are not part of the analysis
Say we need to filter values for the Product Line.
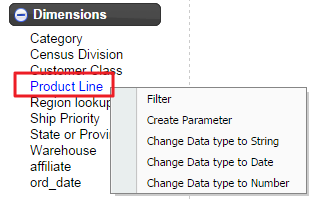
- Right click on “Product Line”
- Select “Filter”
It displays the same filter window but now the dimension member is ‘Product Line’
We will select just Office and Paper product lines
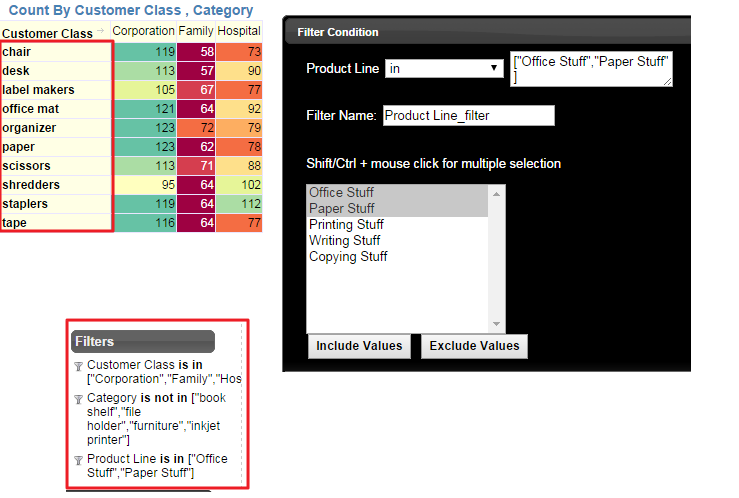
After applying the product line filter, we notice that a new filter is added in the Filters and the result changes accordingly.
The analysis output is the effect of combining all the filter conditions together.
[Section C]
Changing Data types of Dimensions
[C.1] Date Fields
By default all dimension fields are assigned an alphanumeric data type. So we have DateTime fields then we can change the type accordingly.
In our case, the field “ord_date” is a Date field
We right click on it and select “Change Data type to Date”
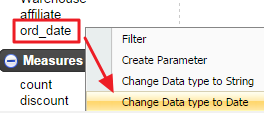
The operation will add Date Hierarchy columns as shown below
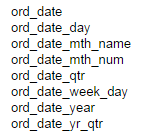
Each field in the date hierarchy is a new field added directly to the dataset. This works only with CSV or pasted Dataset.
If you have a large dataset (say more than 10,000 rows) then it may take few more seconds to create this date hierarchy columns. Once created you can save the Dataset and then re-use the data model repeatedly.
[Section D]
Create Dashboard Parameters
Just like adding Filters to the analysis, you can add these filters as interactive parameters to the Dashboard.
Let us add the Analysis to the Dashboard
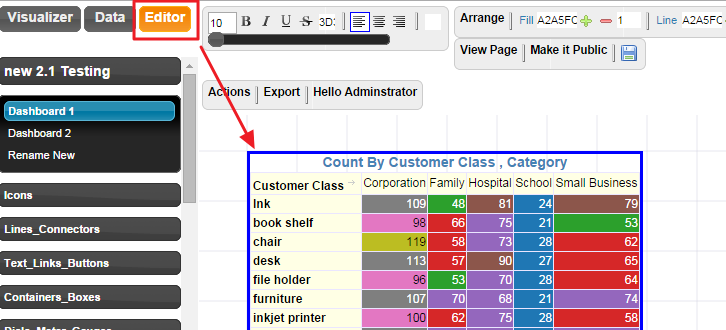
Assuming you have saved the dataset to the dashboard, it will switch the Tab to ‘Editor’ and add the analysis to the dashboard
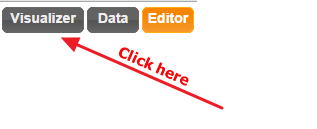
Now go back to the “Visualizer” Tab
We will add the Category field as a Dashboard Parameter
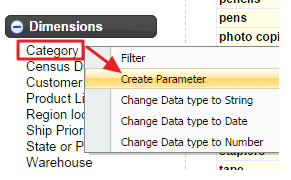
- Right click on the Category field
- Select ‘Create Parameter’
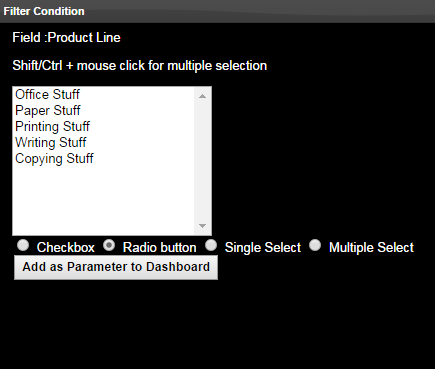
4. It will show this parameter screen
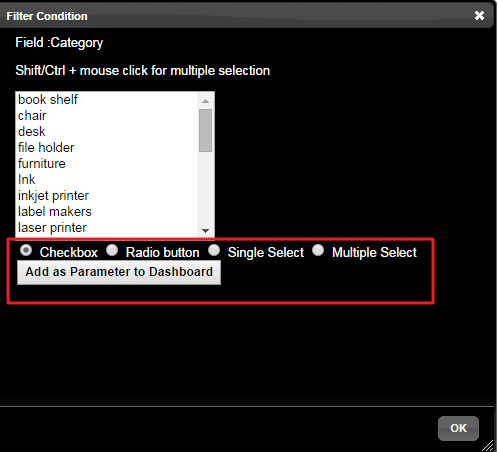
5. Notice it gives you the option to create your parameter as checkbox, radio button, single select drop and multi select box
6. We will keep the selection as ‘Checkbox’
7. Click on “Add as Parameter to Dashboard” button
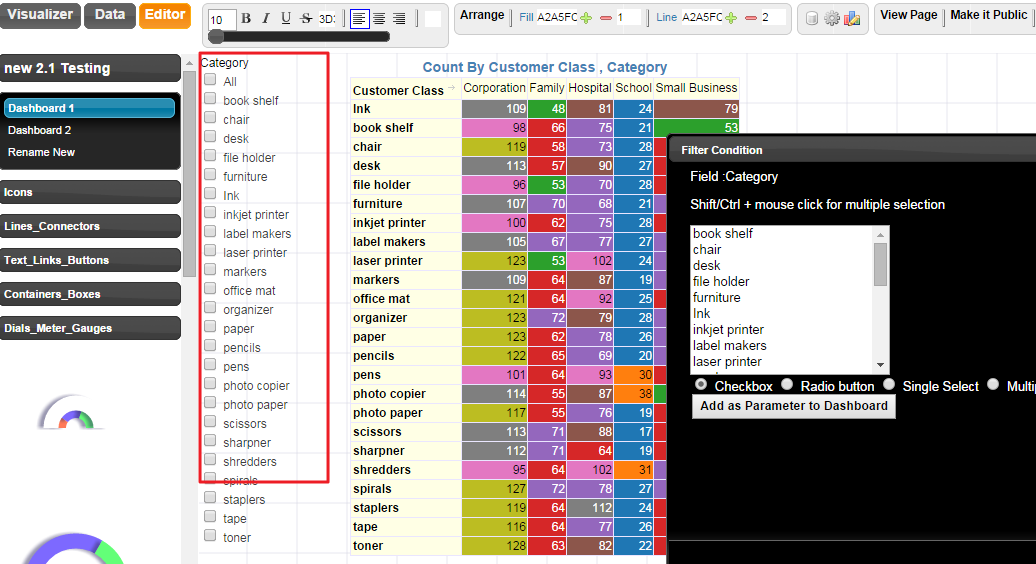
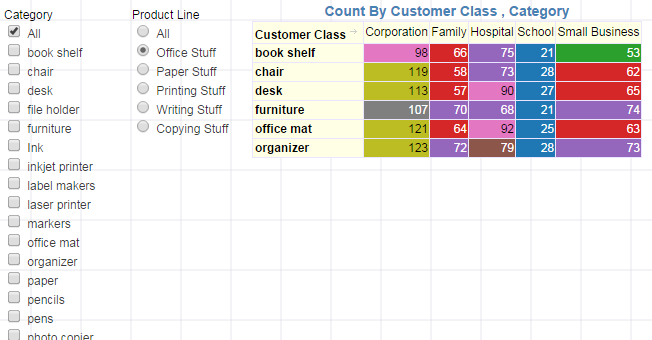
8. It adds the following checkbox to the dashboard in the Editor Tab
9. The editor is free flowing so you can easily place the parameter anywhere on the dashboard. Make some room so the analysis and parameter stay together
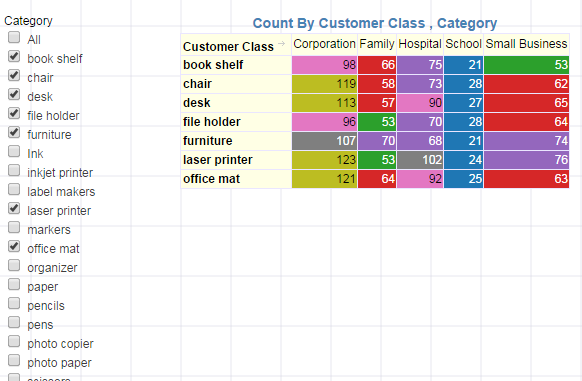
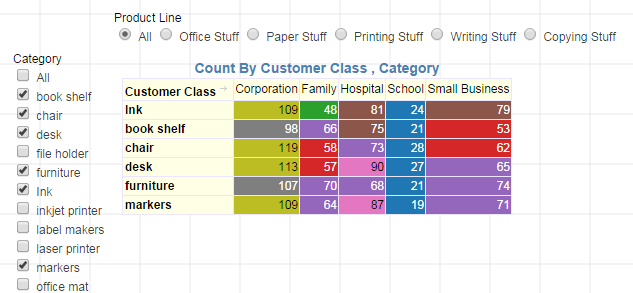
We can now interact directly with the checkboxes and see that the analysis responds accordingly
We will add one more parameter for Product line as a radio button and this is what we get
Since the Product line has fewer values, we can choose to make it horizontal
1. Right click on the Product line parameter
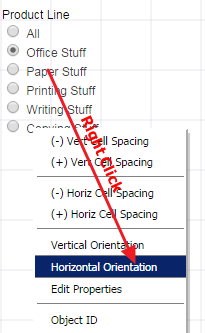
2. Select ‘Horizontal Orientation’
3. The parameter may appear somewhat like this
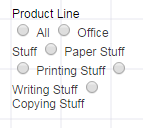
4. We will simply expand its border to make it neat and horizontal
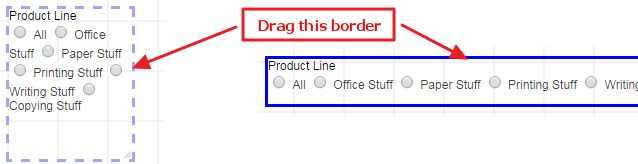
Drag the dotted border around the parameter and stretch it horizontally to fit all the values.
5. We rearrange our parameters and analysis and this is what we get
6. NOTE: If you have conflicting parameter selections then you may end up with no display in the analysis which means there is no data to display for the given filter conditions.
All the parameters and analysis that belong to the same dataset are connected to each other automatically.
[Section E]
Create Formulas
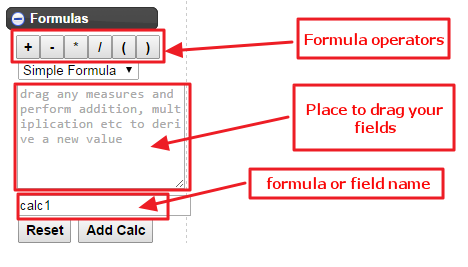
Simply drag your measures and perform mathematical operations to derive a new field
e.g Let say we want to generate total shipping cost (assuming the shipping cost is listed for each unit)
1. Drag the “qty” field { Note: Once you drag, it instantly changes to the data[‘qty’] format }
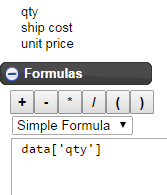
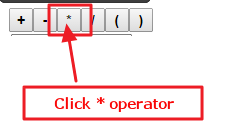
2. Click on the multiplication operator “*”
3. Drag the “ship cost” field
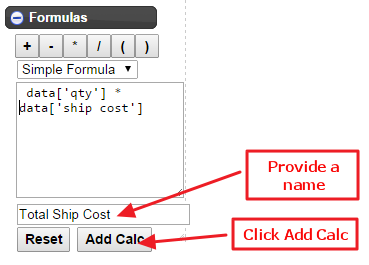
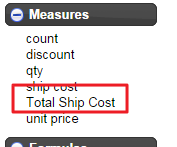
4. Provide a name to the new formula
5. Click on “Add Calc”
6. A new calculated field is added to the dataset