The Most easy to use Data Visualization Software
InfoCaptor is your go-to software for data visualization that lets you turn your data into meaningful insights
- Browser based Tableau like Drag and Drop visualization software
- Explore and analyze your data without a single line of code
- Perform self service data discovery
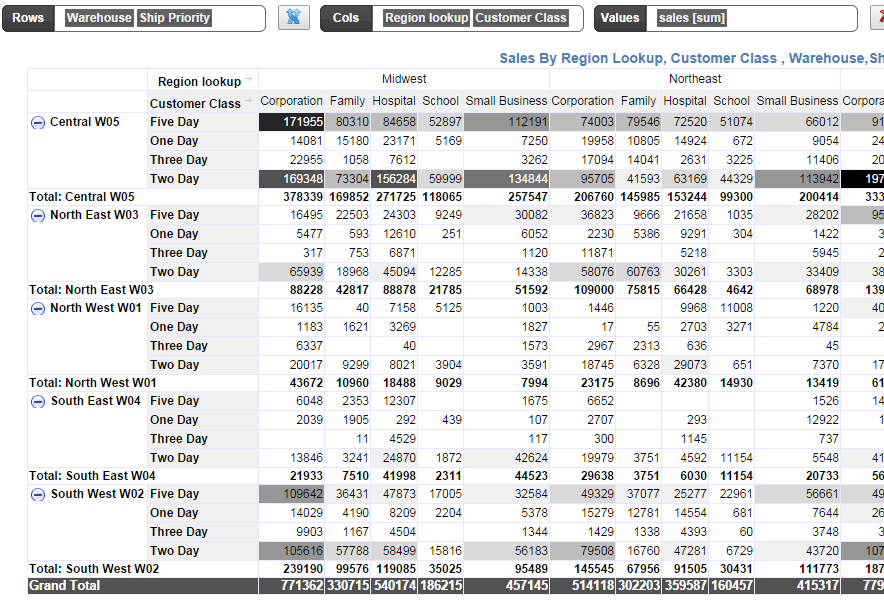
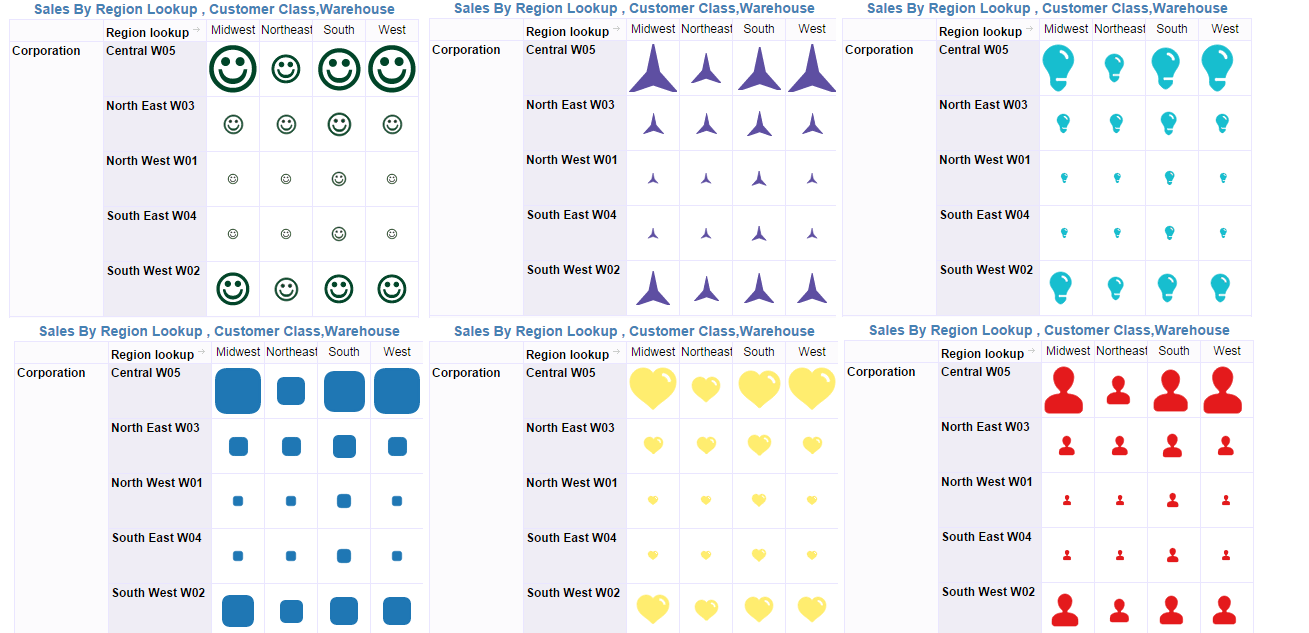
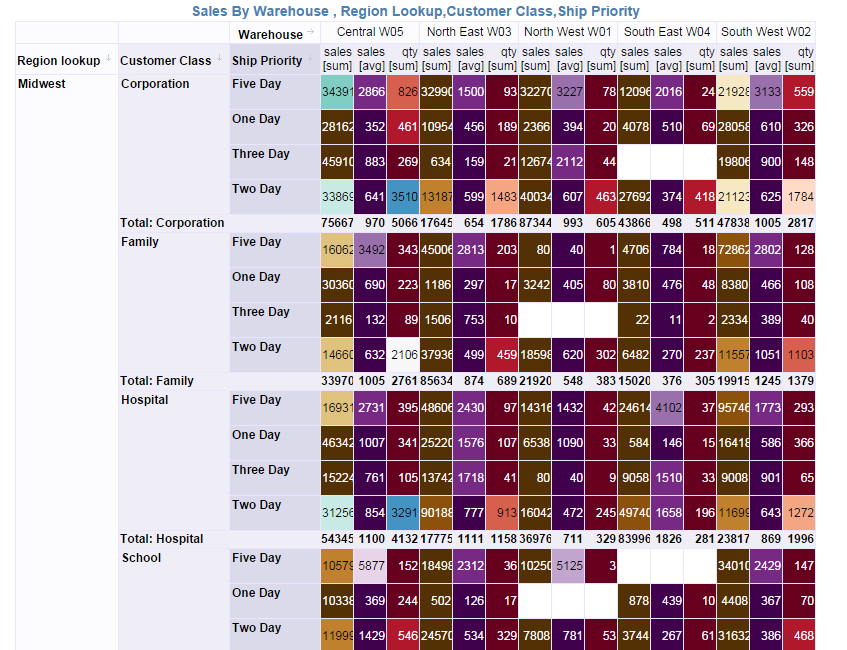
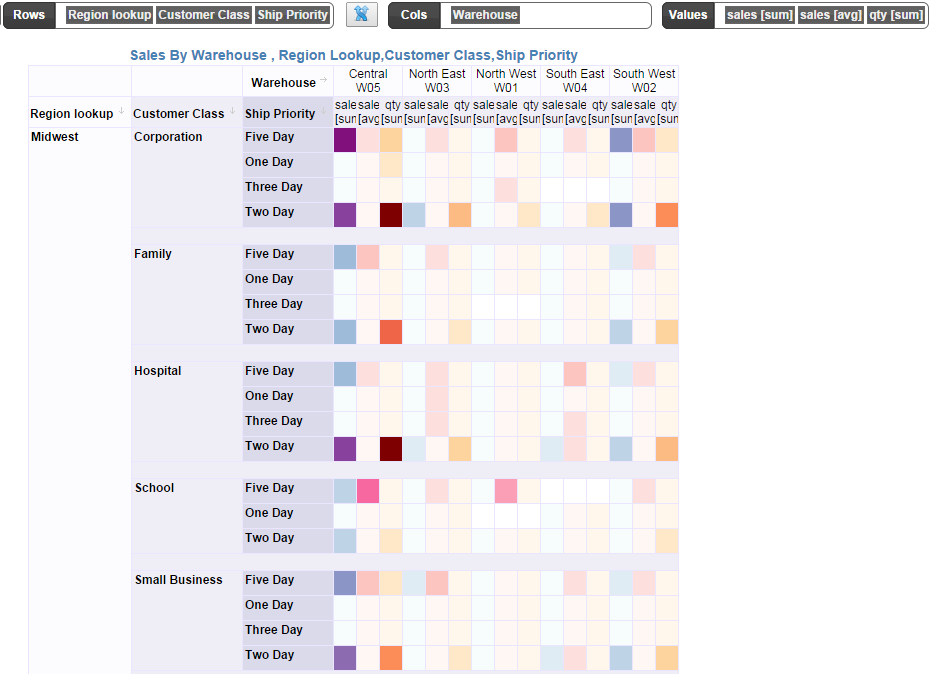
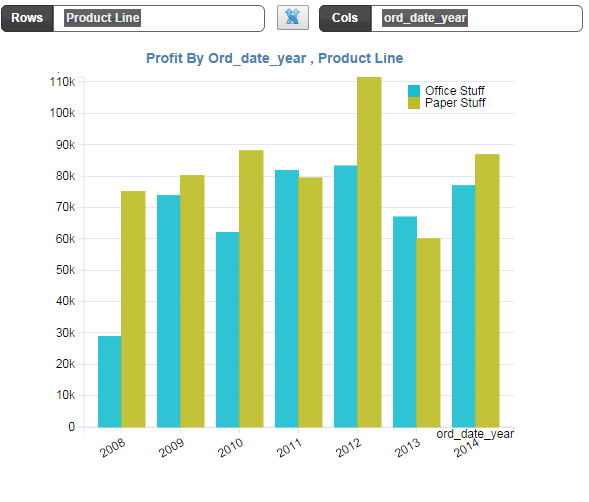
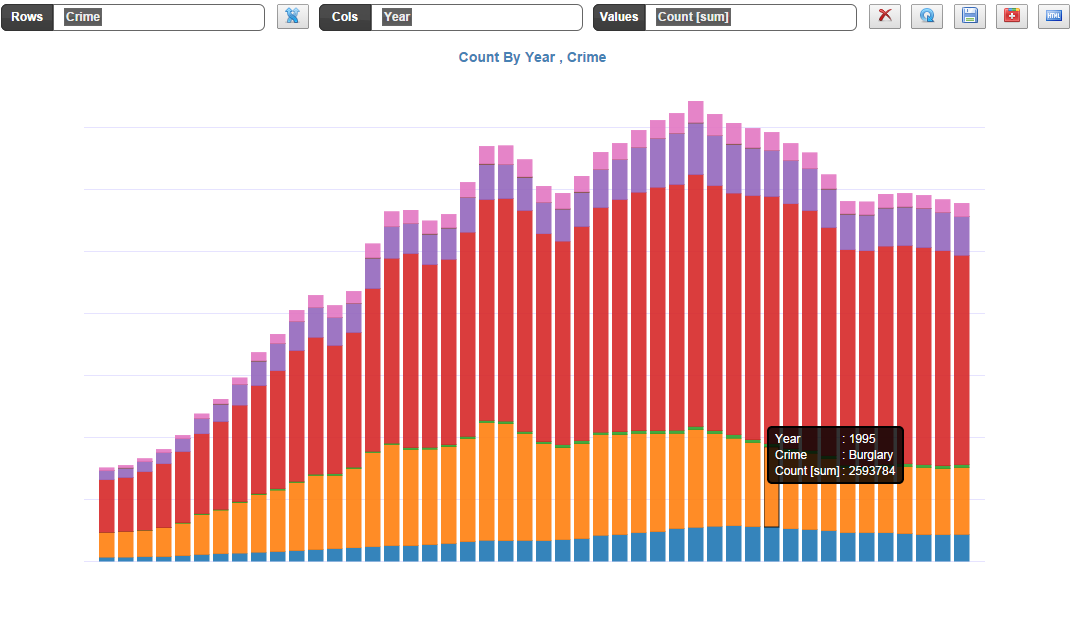
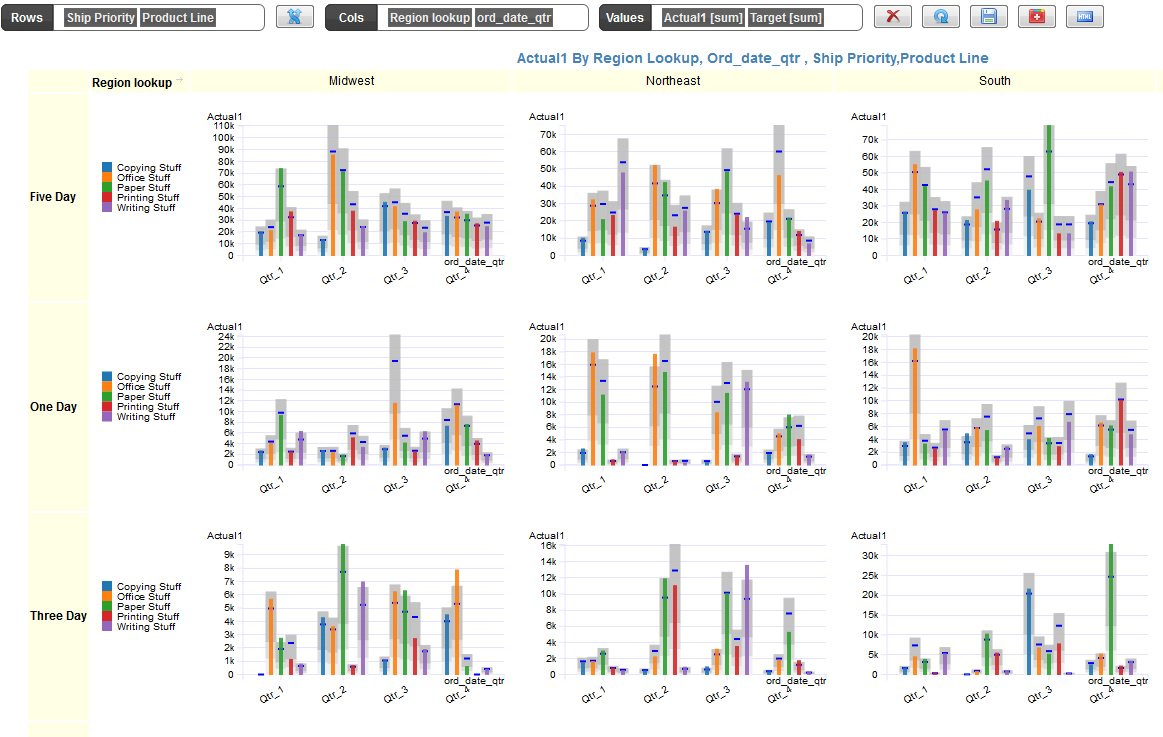
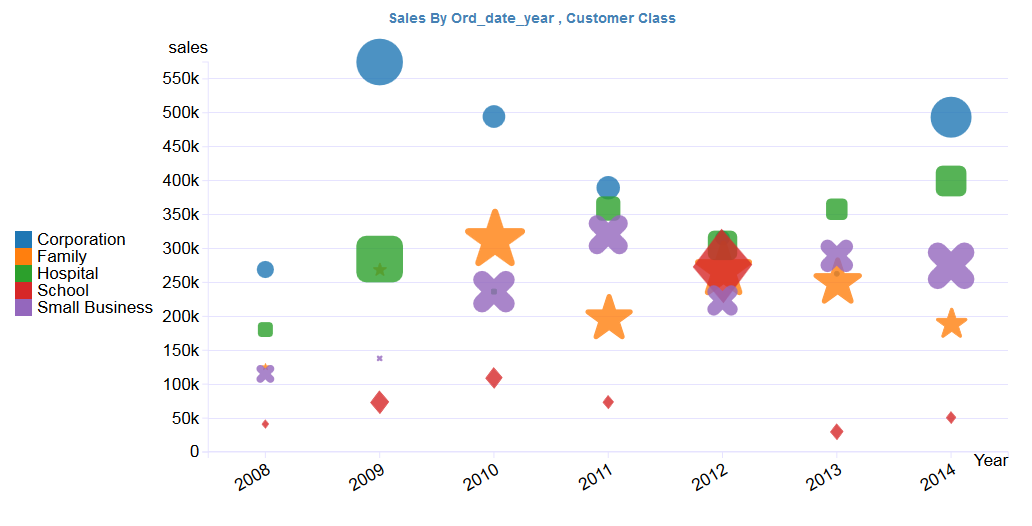
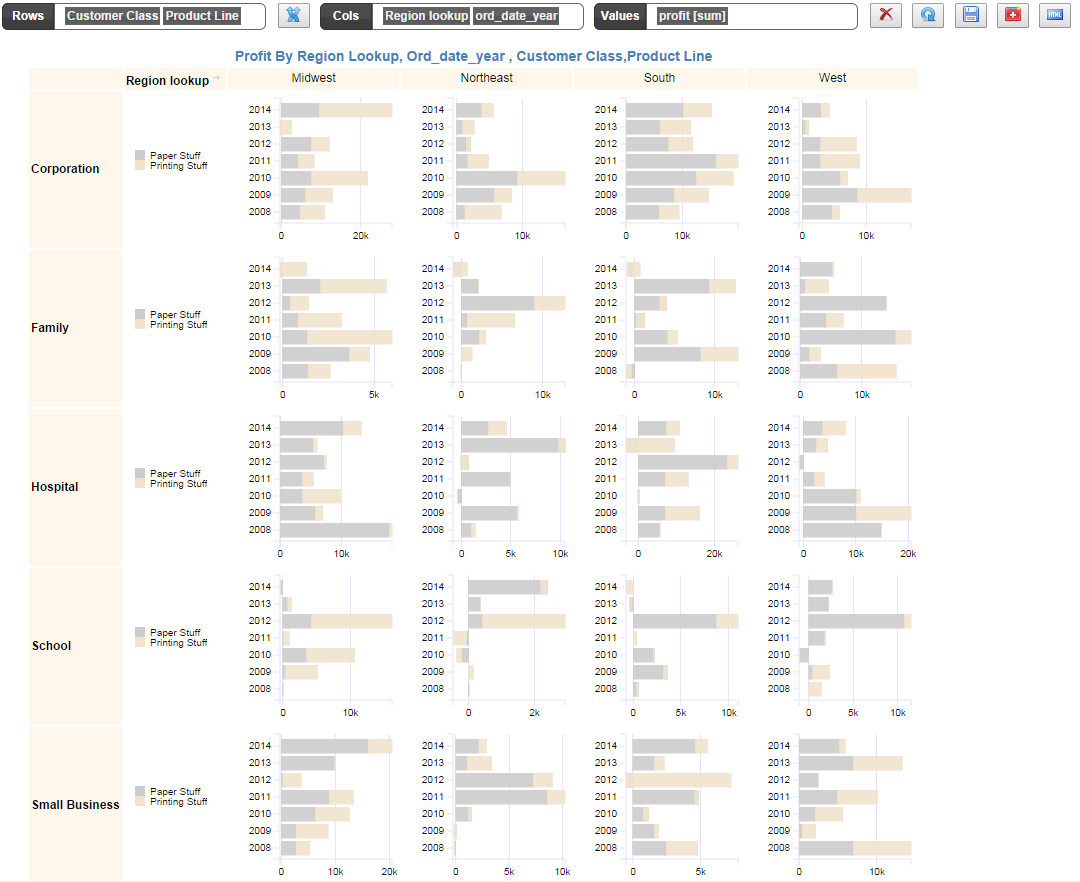
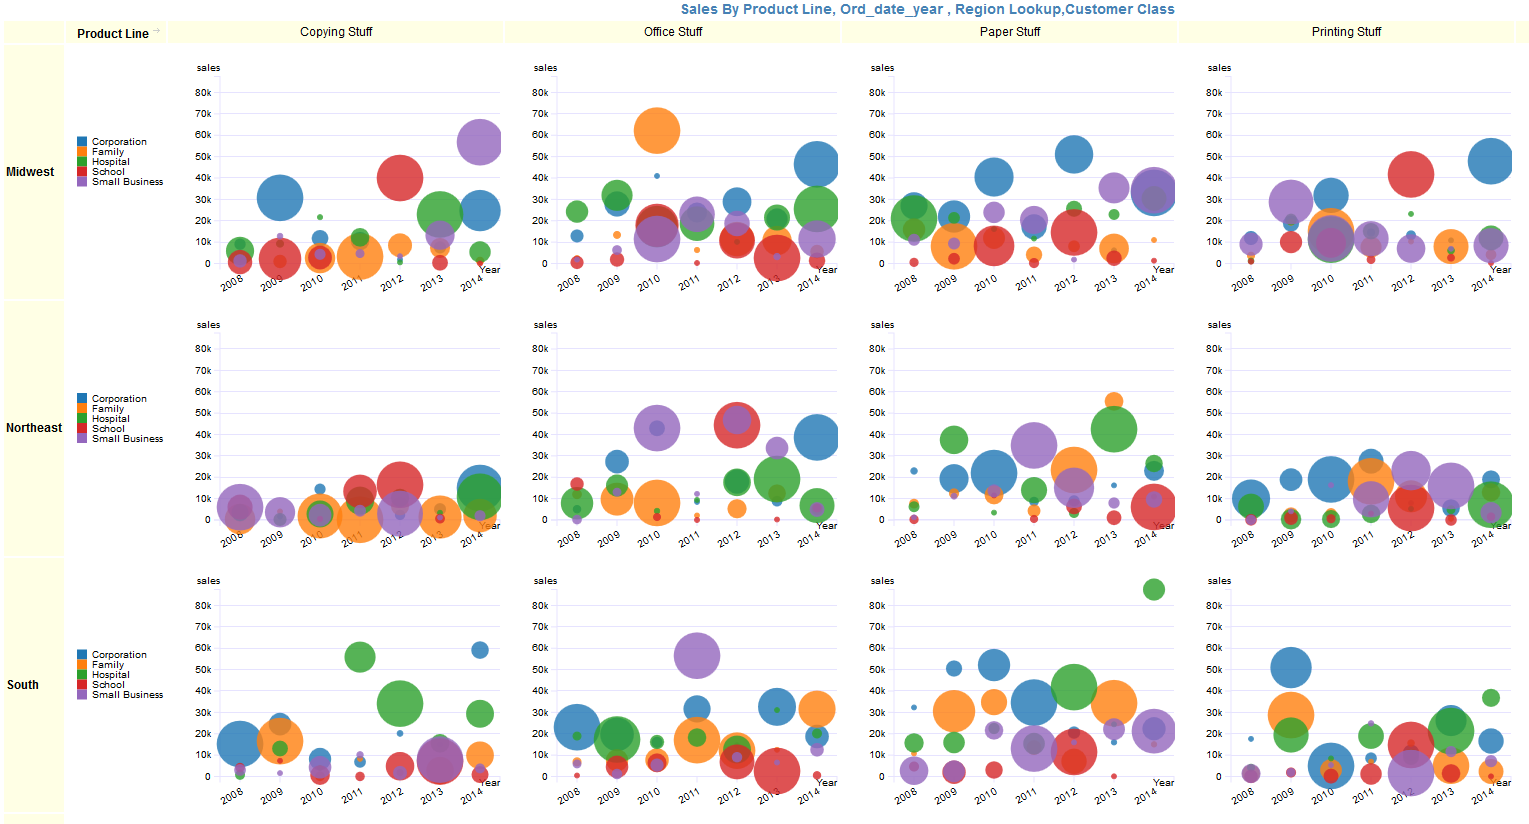
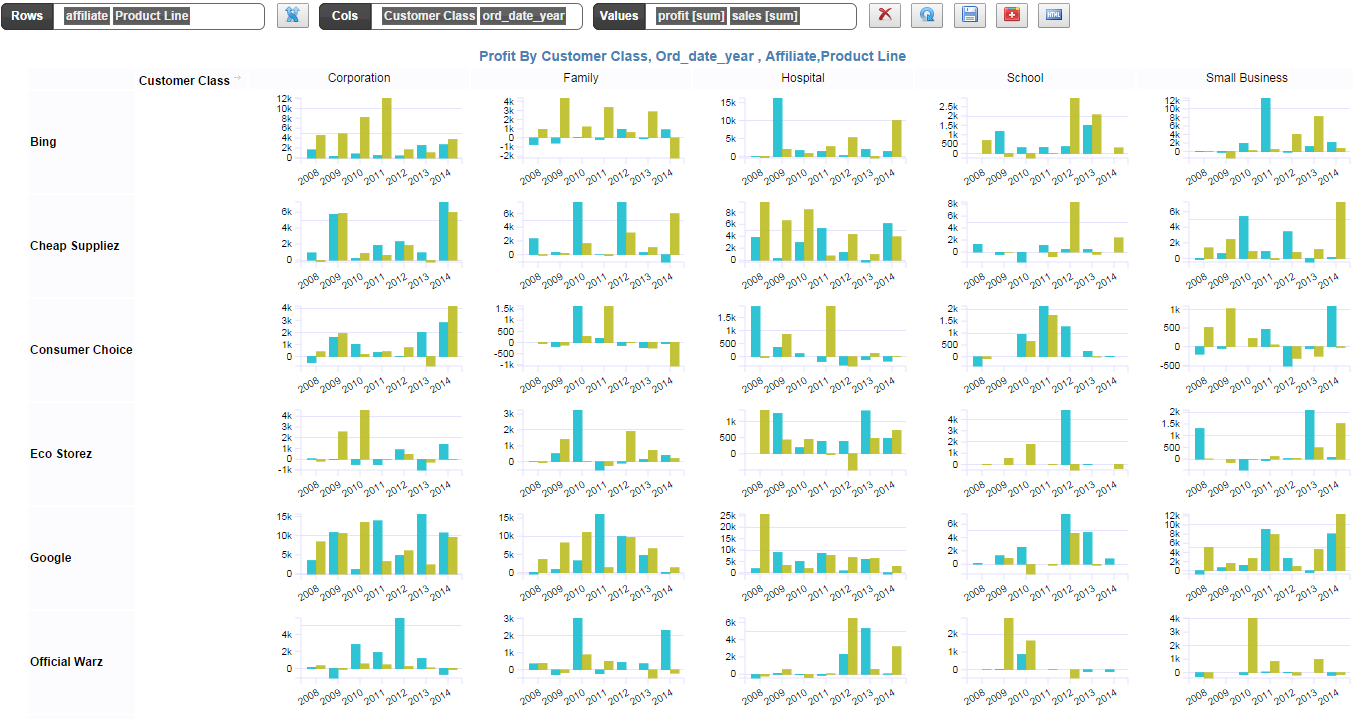
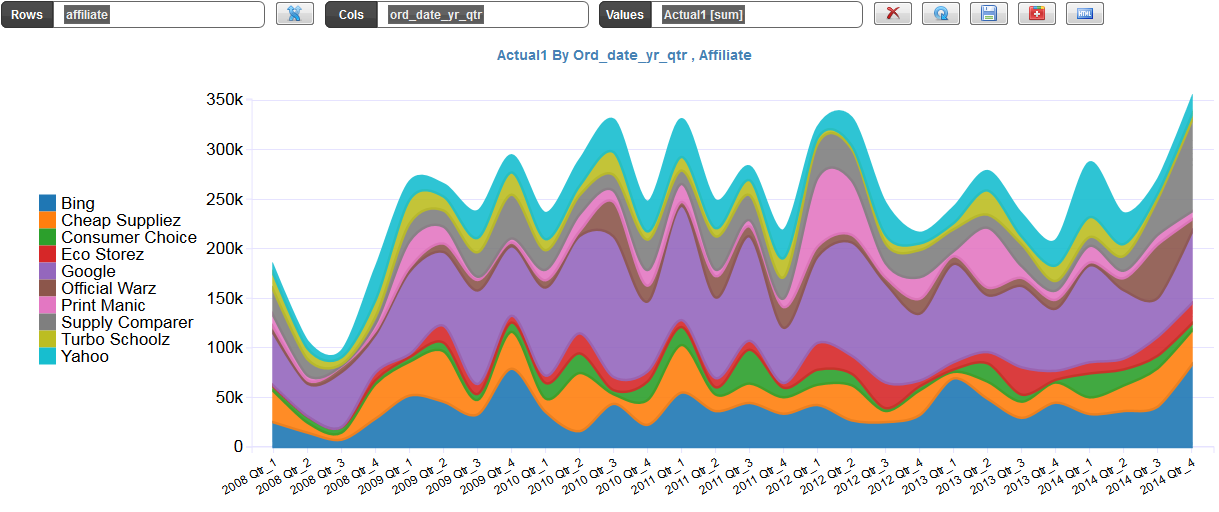
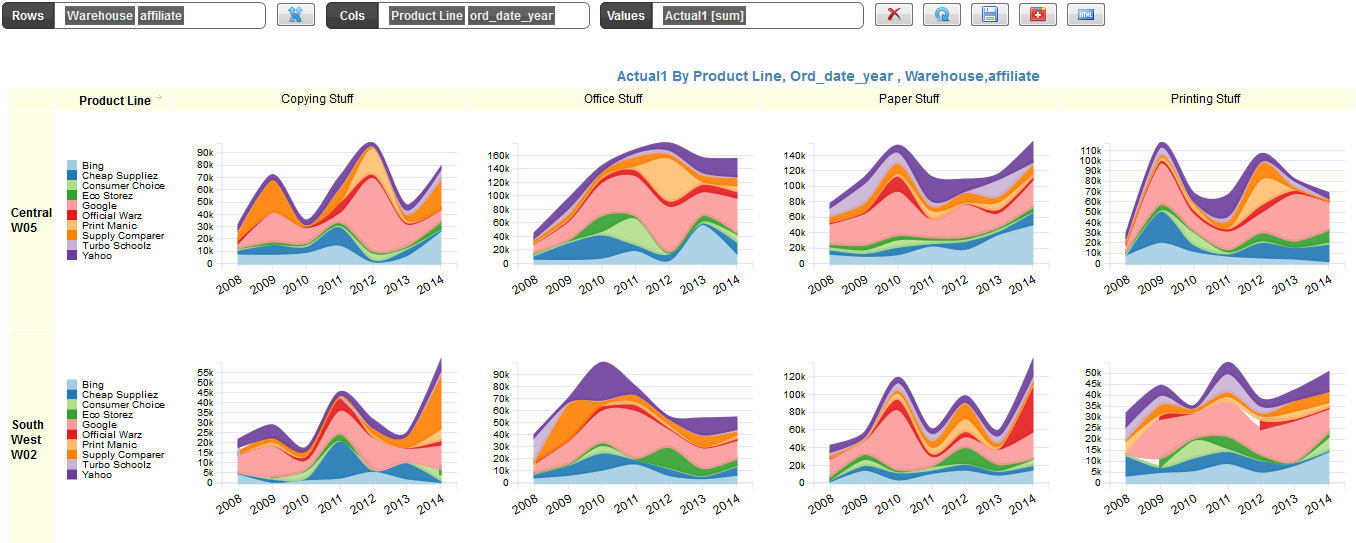
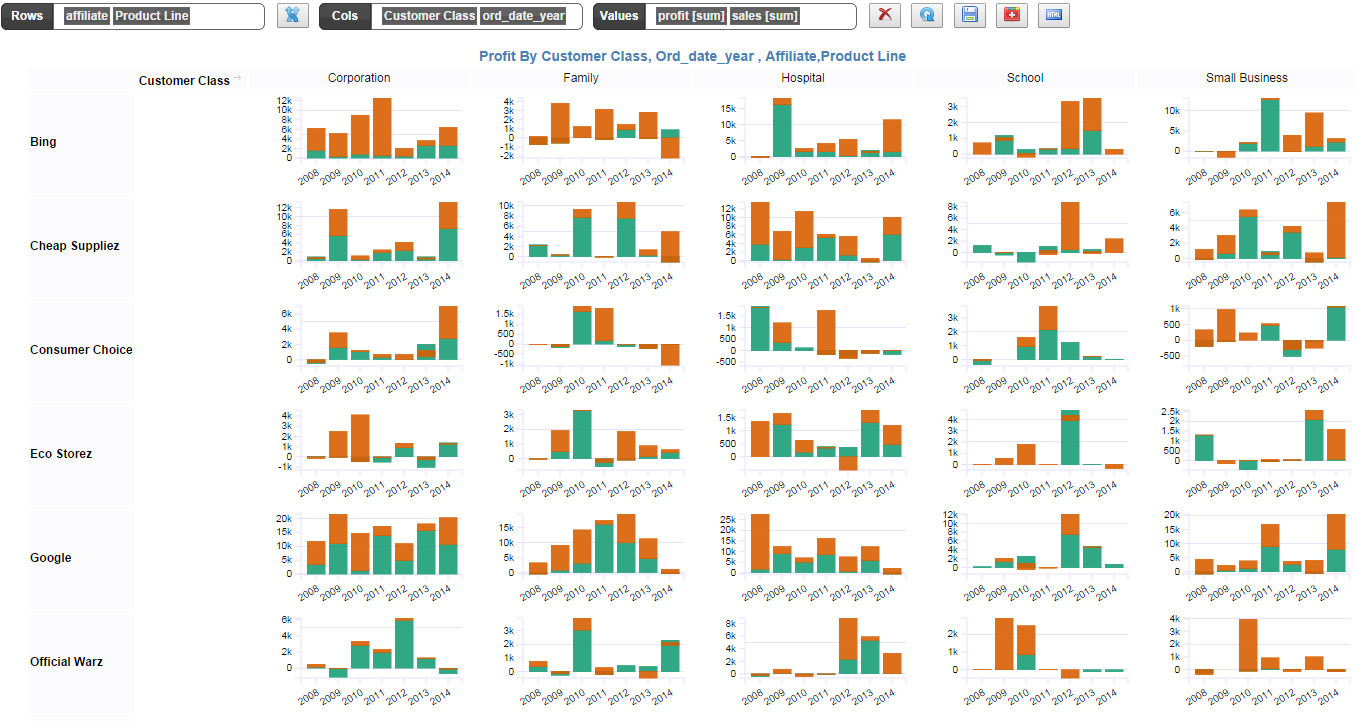
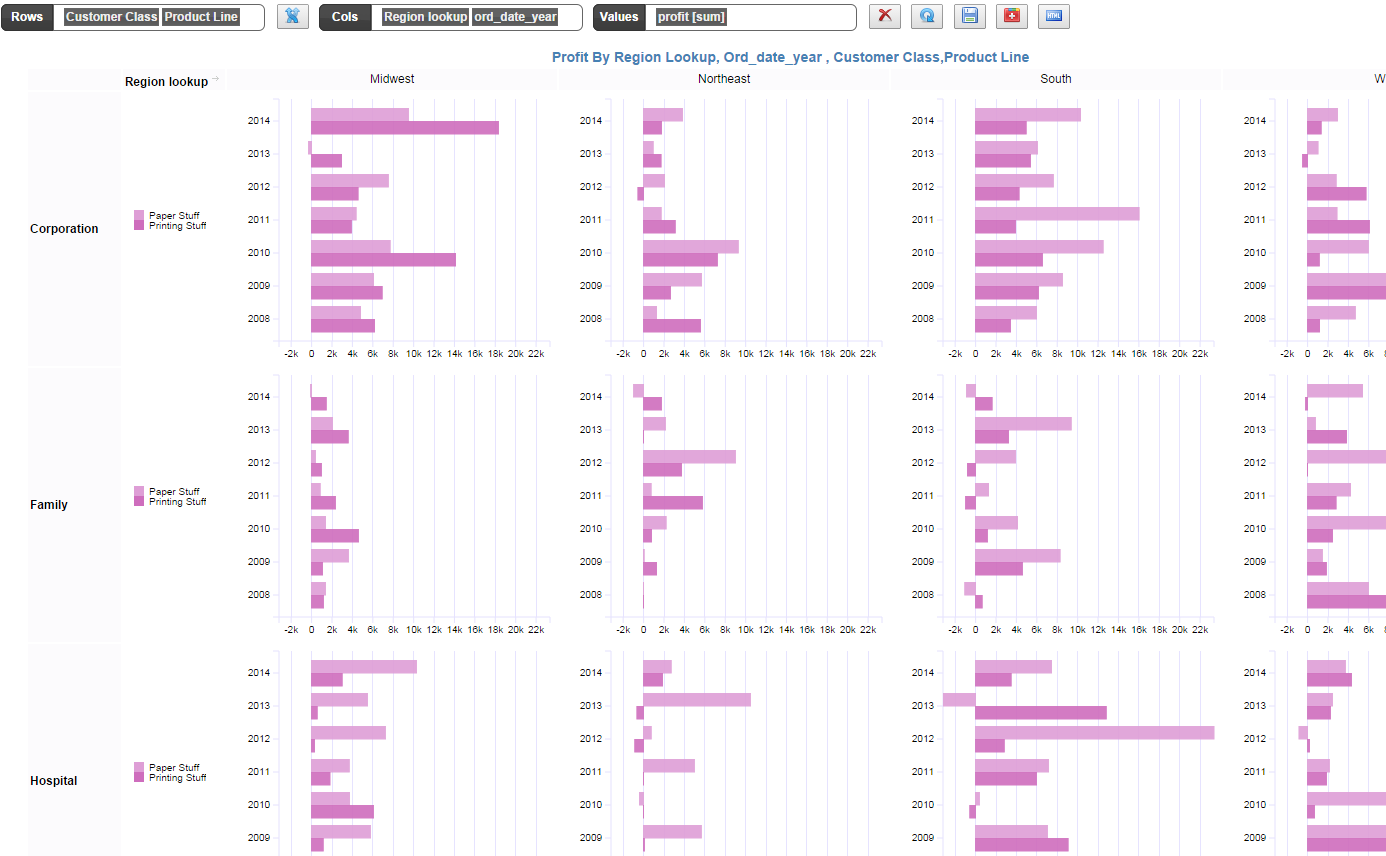
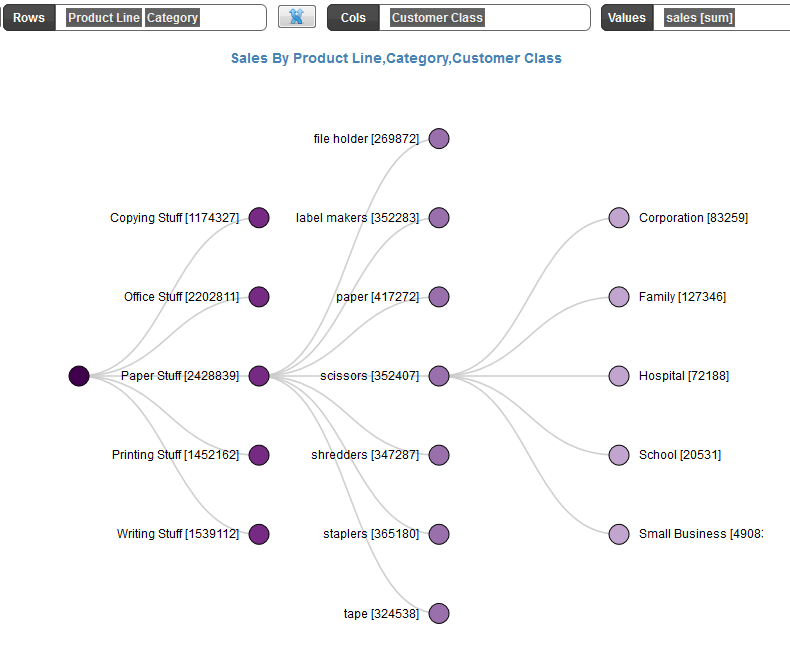
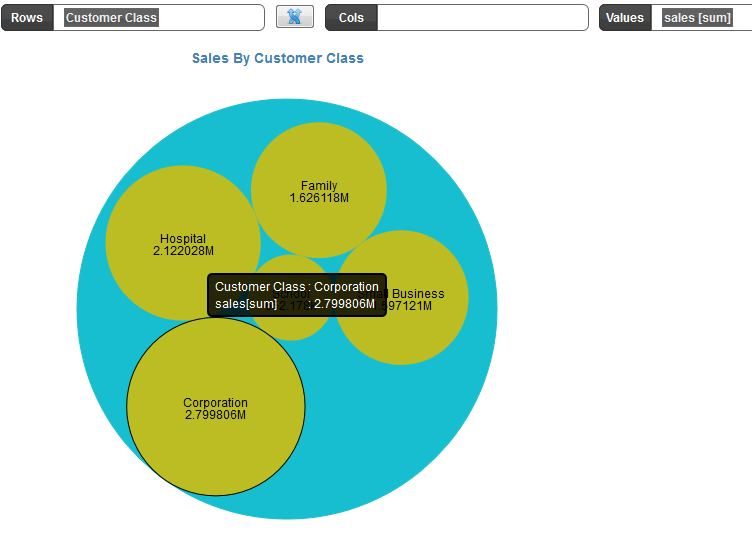
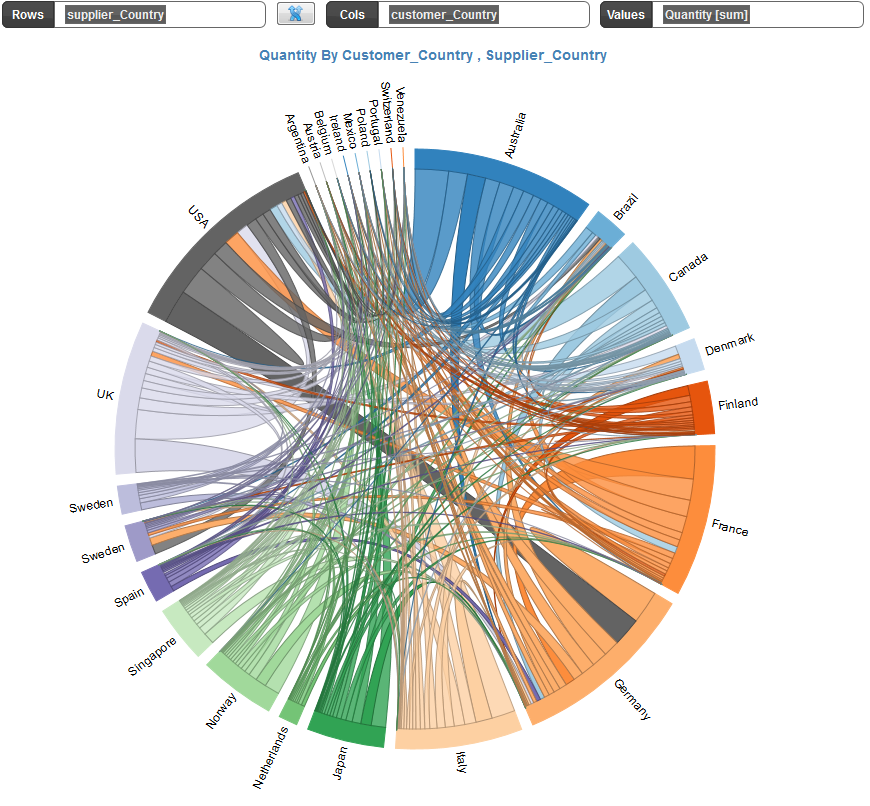
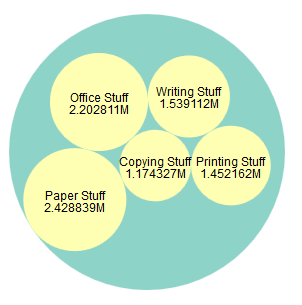
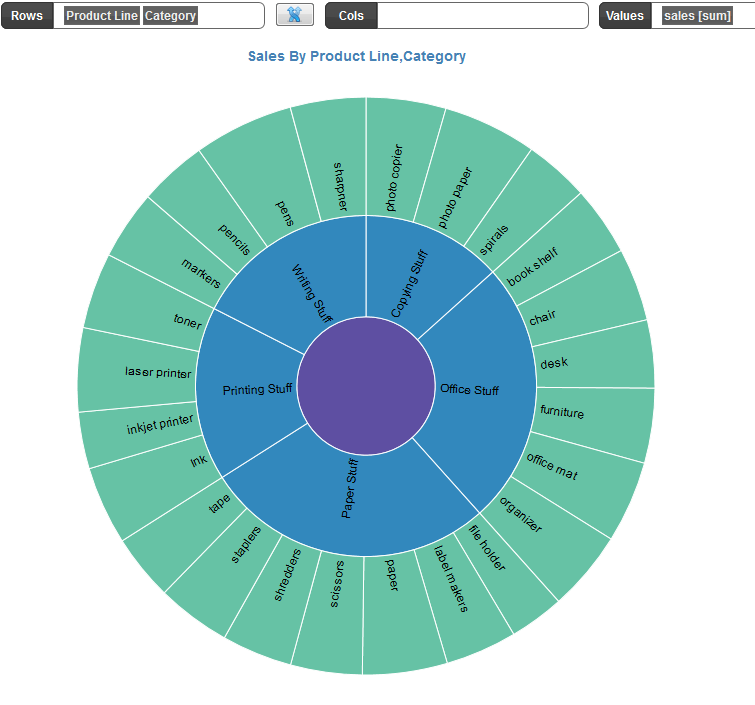
InfoCaptor software comes with a Dashboard Editor and Visual Analyzer. Our software for data visualization helps you to derive the best visual representation of your data. InfoCaptor’s software for data visualization is built using the same concept of Excel’s Pivot table. Just like you add columns to Rows and Columns bucket to make a multi level pivot table, so is the case with InfoCaptor Visual Analyzer. This mechanism is the core engine that allows you to build hierarchical reports and charts
consistently.
In today’s world that is increasingly driven by data, most companies are literally drowning in an increasing mass of business and non-business data. Ecommerce companies using wooCommerce, Shopify, Bigcommerce, Magento or any other platform are getting the best of the tools to run their stores but if you look at the state of their reporting, there are not many good ways to extract meaningful insights.
InfoCaptor is one the best software that allows non-technical or business person to query database systems like MySQL (wooCommerce or wordpress backend db), Microsoft SQL Server , Oracle or PostgreSQL to make beautiful charts and tables. We call each chart of pivot table as simple analysis within the visual analyzer. These individual analysis can then be published onto a collective dashboards.
A dashboard can be stiched together with all these charts and tables to make a homogeneous application with all filters and prompts.u00a0The results(dashboards and analysis) of our online business intelligence software can be shared using links or role based access control.
InfoCaptor gives you the freedom to create charts, tables, graphs and other data visualizations without you having to wait from the IT department.
u00a0