
One of the top queries on every analyst’s mind is
I have so many Excel spreadsheets full of data, How can I use Excel Dashboard software with my business?
It does not matter whether your question is “How to create dashboard in excel” or “How do I create dashboard using excel” or “How to build a dashboard“. The main idea here is to understand the real pain that you want to deal with.
If we re-phrase the question it should be simply “How do I make sense of all the data contained in my spreadsheets?” then you are already coming close and you are not focused on the means.
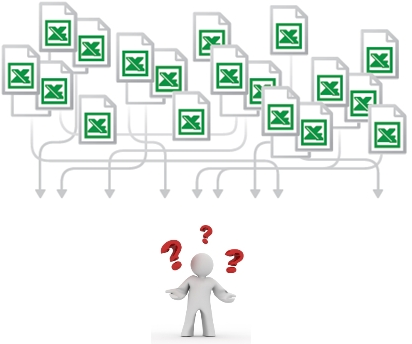
We have seen this in every company and organization. It does not matter big or small companies. Companies have database systems and IT does not have time or resources to work with the analyst to help them with their business intelligence need. Analysts are working hard to get the data extracts into excel spreadsheets from different systems. Then they embark on the giant task of making sense of these data and create a presentable view in the form of Dashboards and reports. Every month it is the same story repeated,
- Assemble the data
- Validate the data
- Merge or disect it further
- Create calculations
- Summarize the data
- And finally add worksheets with charts
- Copy paste the screenshots into powerpoint
- Send it to the management as part of the month end review
If you are looking to creating dashboard using excel and within an excel file, then we would advise you stop that thought process and carefully read about the dangers of this approach in the following paragraphs.
If you use Excel Dashboard Templates for your real dashboarding needs then you may
end up with any of the below problems.
- Big Bulky and bloated excel files
- Undocumented Macros
- Zero verification on the data authencity
- No way to refresh the dashboard (lost productivity)
All of the above are serious issues in themselves. We have seen customers come to us with huge excel files with upwards of 20 worksheets filled with lookups, pivot tables, calculations and everything excel has to offer. The same file also contains additional worksheets with charts and summary data that they call it excel dashboards. The brave analyst had put this dashboard when her boss requested for a dashboard and slowly it got bigger and messier, undocumented macro formulas, no checks on the validity of the calculations and finally the biggest problem of all was that this whole cycle of tasks became the only duty of this analyst.
So please don’t think of use Excel template based dashboards, instead we offer you a very good alternative as below that is one of the simple idea : Use Modular Design – Keep Data and Presentation Separate
How? – Use Excel only for storing your data. Nothing more. Do not build any visualization in the same place where your Data resides. In short, your excel files should contain only the data.
Benefits of excel dashboard using this approach
- Your dashboard or presentation layer is independent – Dashboard definition is stored separately
- Increased productivity – When you have fresh data just refresh the dashboard, no redevelopment needed
- No Messy Excel Macros or coding knowledge required – Just drag and drop tables and visually build Tables, Charts, Speedometer, Gauges, Dials, Thermometers and more charts
- Simplified Distribution and Presentation – You can Export the Dashboard to PDF or HTML and just send them as attachments
- Save Time – Just build the dashboard presentation layer only once and automate the refreshes.
Excel dashboard definition : It is a visual interface that provides at-a-glance views into key measures relevant to a particular objective or business process.
A dashboard consists of three key attributes.
- Displays data graphically (such as in bar charts, sankey, circle pack). Provides visualizations that help focus attention on key trends, comparisons, and exceptions.
- Displays only data that is relevant to the goal of the dashboard.
- Contains predefined conclusions relevant to the goal of the dashboard and relieves the reader from performing his own analysis.
InfoCaptor excel dashboards perfectly aligns with your requirements to aggregate data from multiple csv and excel files.
We have this extremely detailed step wise tutorial on how to create your excel dashboard. The tutorial will guide you on how to prepare data and how to analyze, create charts and finally publish into a web based dashboard.
You can see some of the Excel dashboard examples below.
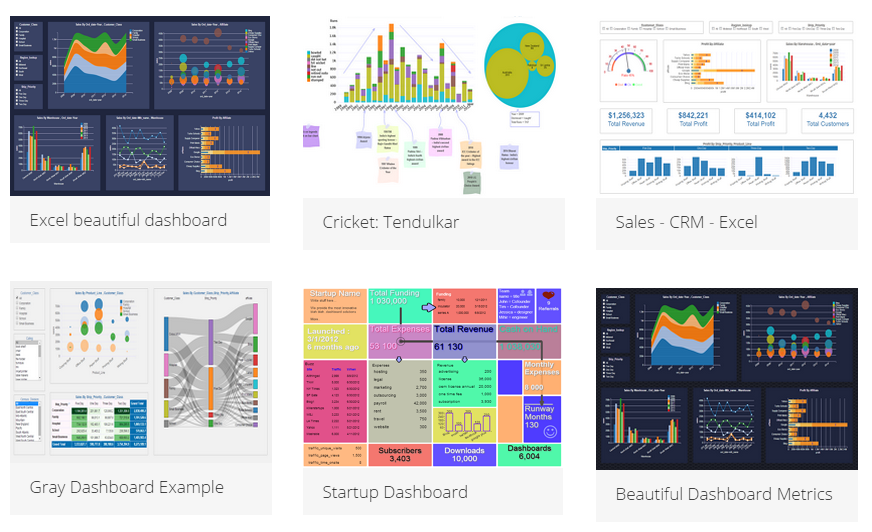
Learn more about Business Intelligence and Excel Dashboards