Dashboard Examples, Real dashboards made with public datasets. Sample charts and graphics that you can use as templates or inspiration.
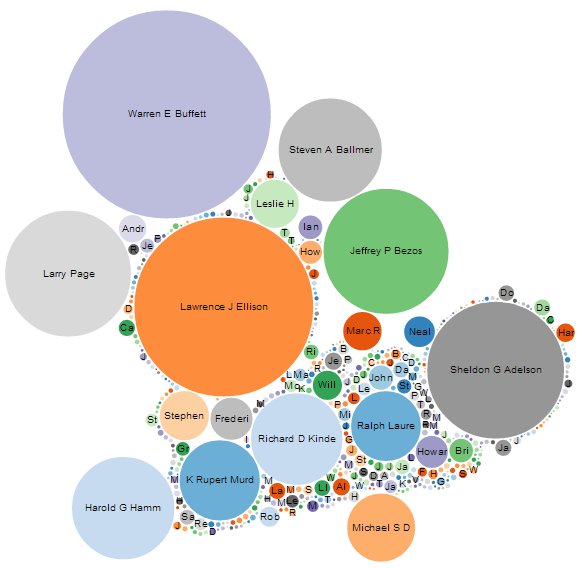
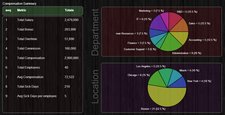
CEO Compensation interactive visualization
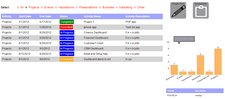
Cloud/SAAS Dashboard statistics
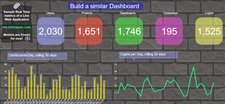
The above dashboard is my.infocaptor.com statistics. It shows number of users,dashboards,projects,and groups created. It shows rolling 30 day chart for dashboards created per day, logins per day. There is also a chart showing user registrations for each month.
Status Dashboard using Google Spreadsheet as data source
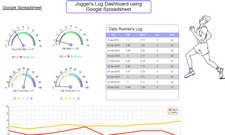
Jogger’s Dashboard using Google spreadsheet as source
RSS Dashboard – iGoogle dashboard
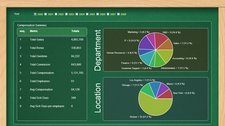
Human Resource Dashboard – HR analytics (dark background)
HR Dashboard – White background
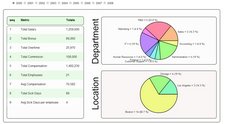
HR dashboard – green background
XML Dashboard – built using pure XML as data source
Tutorial on how to build Dashboard from XML Source https://www.infocaptor.com/build-a-dashboard-using-xml-as-data-source
Inflation Dashboard – Consumer Price Index
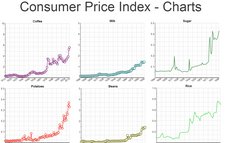
Tutorial on how to build the above https://www.infocaptor.com/consumer-price-index-charts-and-dashboard
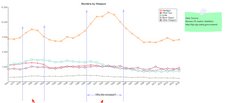
Murders by Weapon visualization Dashboard
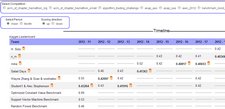
Kaggle Leaderboard Visualization Dashboard
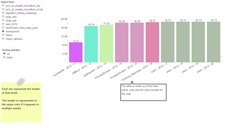
Kaggle team submission visualization for each week
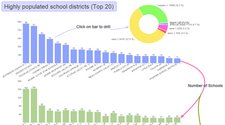
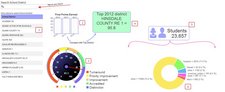
Colorado School Demographic Dashboard
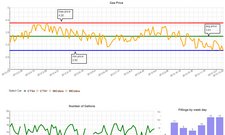
Gas mileage usage tracking dashboard
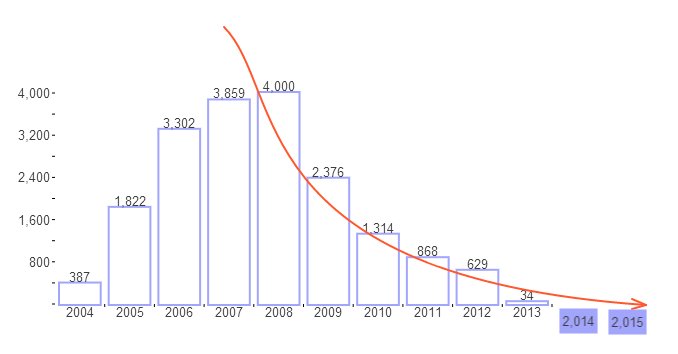
Joel on Software Forum Participation – Rise and Decline
CEO Compensation interactive visualization
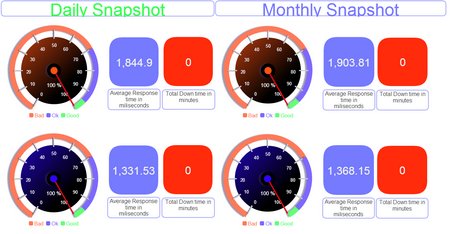
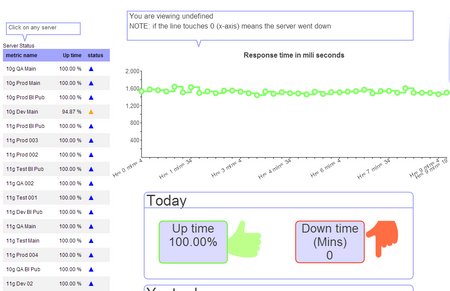
Website or Server up/down monitor like pingdom
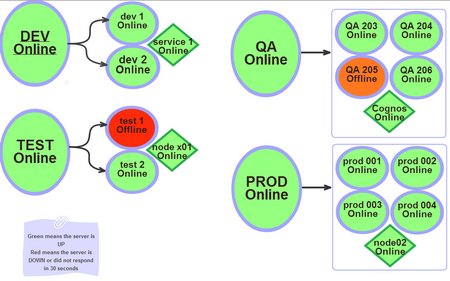
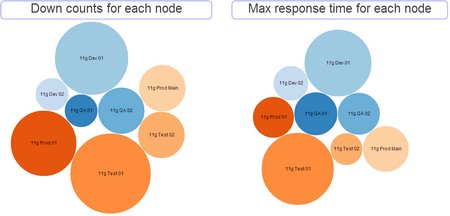
Server Detail metrics and drill down
Server website health summary dashboard