

Photo by Dan Chmill, via Flickr creative commons.
Table of Contents
Energy Dashboard metrics for Pittsburgh Municipal buildings
Today we get our hands busy analysing data from Pittsburgh Open data. Few months ago we did Chicago wifi usage visualization and this is our first attempt analysing our own city data.
The very first thing we notice is that there is a metric “Energy Cost in Dollars” and seems very easy to understand so we plotted it against each year.
Energy Cost for Pittsburgh municipal buildings over the years
Reduced Energy Cost by 1 million dollars
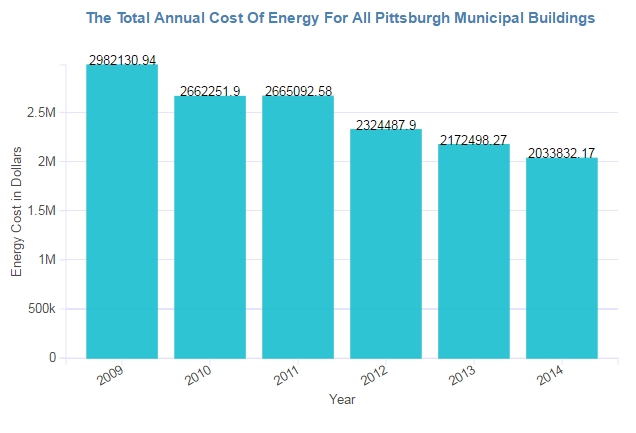
This one chart tells a very interesting fact, the buildings collectively reduced the Energy cost by 31.8% in 2014 as compared to the cost of energy in 2009. We don’t know if the buildings are being run more efficiently or the cost of energy has reduced from 2009 onwards. Either that or the usage of energy has gone down. At any rate it is a very interesting data piece. The cost reduction is close to one million dollars in 2014 alone compared to the cost in 2009. That is a significant savings.
We then plot couple of other metrics using the same bar charts but in the end we built a dynamic interactive dashboard so users can easily pick whatever metric and year as selections.
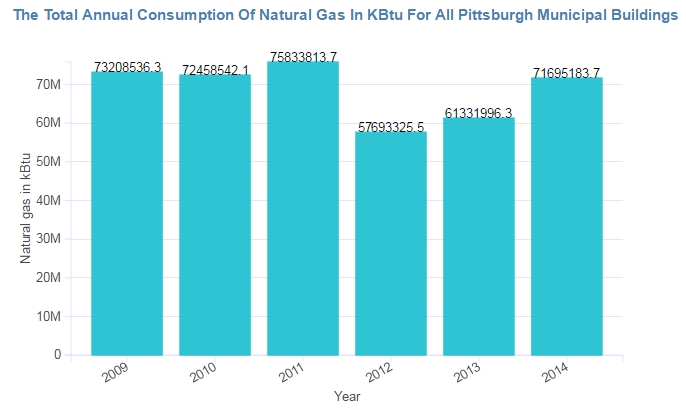
The Total Annual Consumption Of Natural Gas In KBtu For All Pittsburgh Municipal Buildings
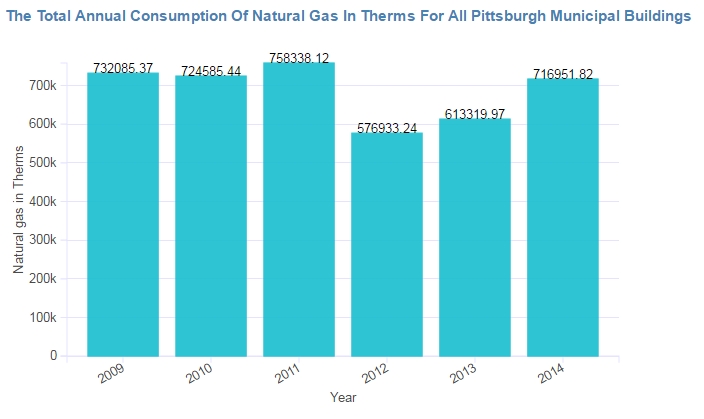
The Total Annual Consumption Of Natural Gas In Therms For All Pittsburgh Municipal Buildings
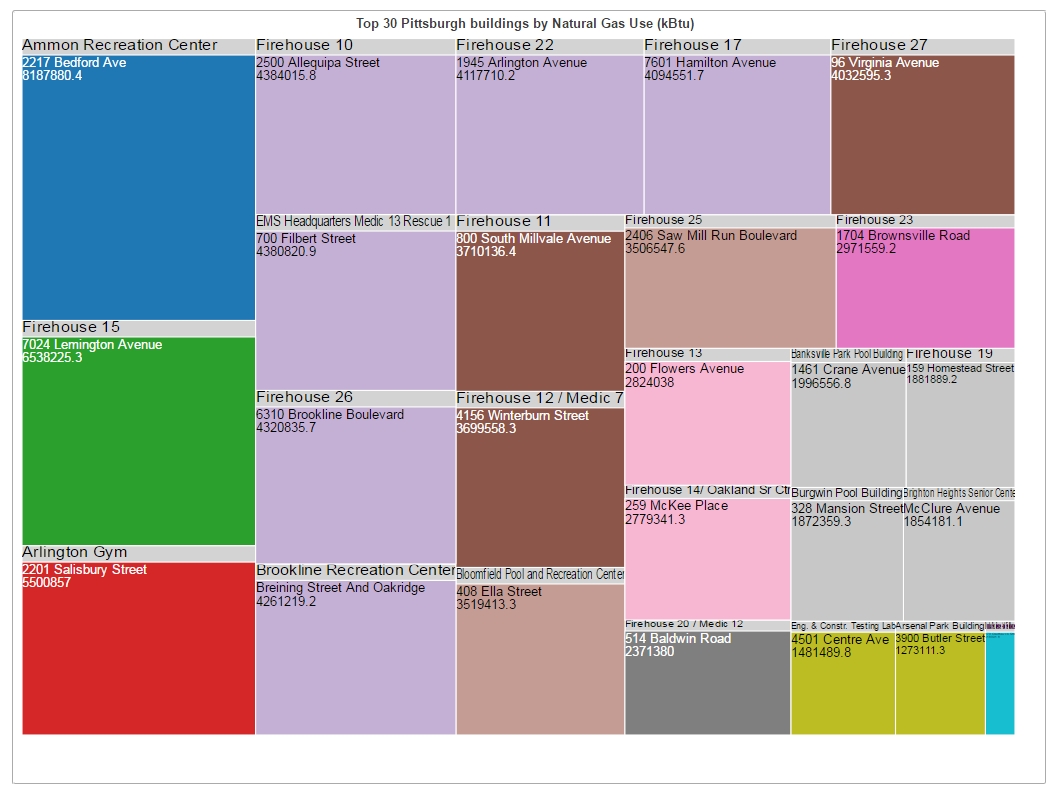
And finally a treemap showing the top 30 municipal buildings by each metric
Interactive Dashboard for Pittsburgh Building Energy Metrics
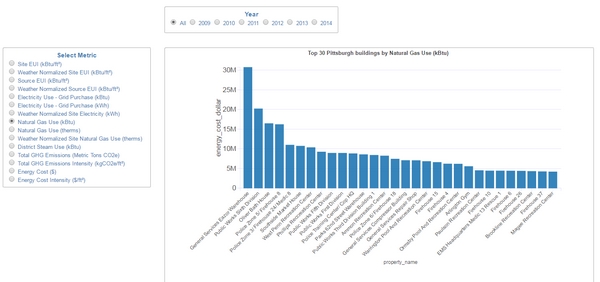
In the above live dashboard, you can select the year and on the left there is a list of metrics. Selecting the metric will dynamically update the bar chart and the treemap below.
Energy meta-data
Data Source : https://data.wprdc.org/dataset/municipal-building-energy-usage
Organization: City of Pittsburgh
Group/Topic: Energy
Department: Department of Innovation & Performance
Data Notes: Data stored and reports generated in Portfolio Manager. Some data is unavailable, to be remedied if possible. Available data is accurate, verified by utility bills.
Data Steward Name: Ariel Lattanzi
Energy Use Intensity of the site: total energy consumed by the building in one year (measured in kBtu or GJ), divided by the total gross floor area of the building
The amount of energy the building would have consumed in one year under 30-average weather conditions (also called climate normals), divided by the total gross floor area of the building. (This enables building performance comparison over time, despite unusual weather events)
Energy Use Intensity of the source: the total amount of raw fuel that is required to operate the building for one year (including all transmission, delivery, and production losses), divided by the total gross floor area of the building
The amount of raw fuel that would have been required to operate the building for one year under 30-average weather conditions (also called climate normals), divided by the total gross floor area of the building. (This enables building performance comparison over time, despite unusual weather events)
The total annual consumption of grid-purchased electricity in kBtu
The total annual consumption of grid-purchased electricity in kWh
The amount of electricity the building would have consumed that year if weather had been climate normal
The total annual consumption of natural gas in kBtu
The total annual consumption of natural gas in therms
The amount of natural gas the building would have consumed that year if weather had been climate normal
The total annual consumption of district steam in kBtu
The total annual greenhouse gas emissions due to building operations as calculated by Portfolio Manager (which accounts for the carbon dioxide, methane, and nitrous oxide emissions from on-site fuel combustion and purchased electricity and district heating and cooling)
The total annual greenhouse gas emissions due to building operations as calculated by Portfolio Manager, divided by the total gross floor area of the building
The total annual cost of energy for the building
The total annual cost of energy for the building, divided by the total gross floor area of the building