
From SQL Query to Analysis
InfoCaptor is extremely versatile dashboard application. It started initially just as “SQL Dashboard“.
What do you mean by “SQL Dashboard”?
This was the MVP (minimal viable product) for a Dashboard tool.
The basic premise of the idea was that a developer can type any SQL query and produce the information. The information is then displayed into any kind of visual. All the widgets within the dashboard editor are data-aware.
What is “data-aware”: Every widget can accept manually punched data (that you directly type into it) or can be sourced from any external source. The external source could be a database or third party web service. Each and every widget from icons to lines and arrows is data-aware and has the ability to use the data-connectors and show information.
In this video tutorial (one of the very first videos – infact you can see the very first version) How to build HR dashboard just using SQL query, we demonstrate the use of SQL queries against Excel Files. While it is extremely flexible in that sense to use SQL queries against Excel files, we have introduced better mechanisms to work with Excel/CSV files.
NOTE to ourselves: Build a newer video tutorial demonstrating the use of plain old SQL queries.
Using SQL queries gives you tremendous power and you can even use Stored procedures to extract data into HTML tables.
For e.g
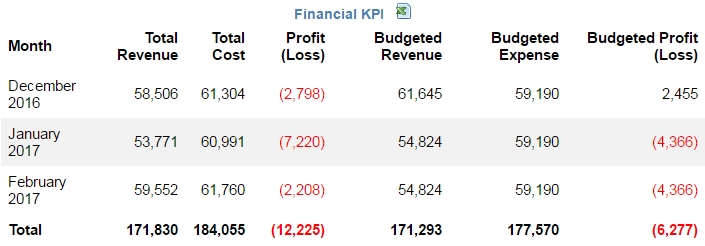
So whatever the Stored procedure returns it will display into the Grid
How do you produce such a simple HTML grid using SQL
There are two ways to use SQL
1. Direct SQL into the widget data source.
2. Create a stored procedure in MySQL/MariaDB to return the SQL results
Why Stored procedure? The SQL editor within InfoCaptor can handle any amount of complex query so there is really not a need to define a stored procedure to acheive the same results. Stored procedure is a good way to maintain and separate complex logic from the client side presentation. Sometimes you may need to perform additional calculations or transformations within the database so that is when SQL stored procedures come handy.
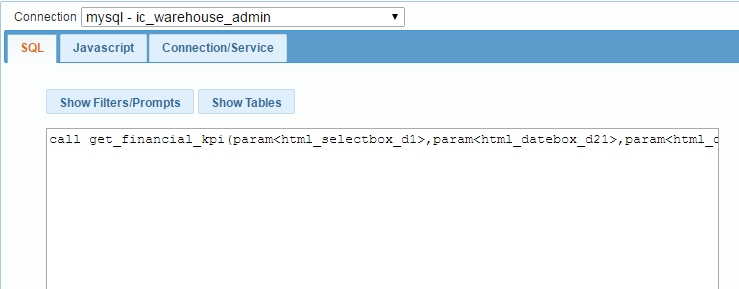
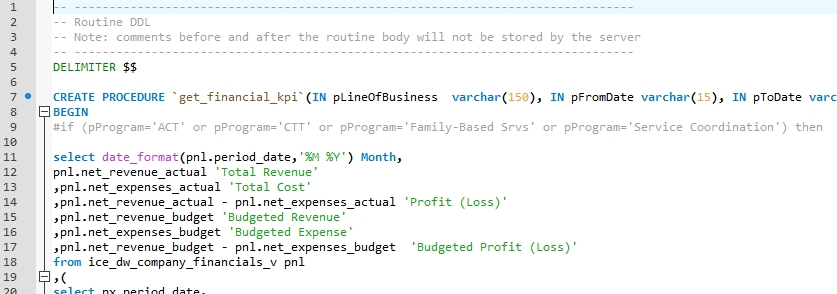
Here is a sample Stored procedure
We call the stored procedure from the html grid’s SQL data source
We also apply the following Javascript customization to color the font red and add the total row
var cols=glb["_odata"].length;
var rows=glb["_odata"][0].length;

var numTableFormat=d3.format(',f');
for (var c=0;c<cols>Total');
continue;
}
else
{
for (r=0;r<rows>< rows+1; i++)
{
for (var c=1; c< cols;c++)
{
if (glb["_odata"][c][i] <0)
{


glb["_odata"][c][i]=''+'('+numTableFormat(Math.abs(glb["_odata"][c][i]))+')';
}
else //if (i==rows)
{

glb["_odata"][c][i]=numTableFormat(Math.abs(glb["_odata"][c][i]));

}
if (i==rows)
{
glb["_odata"][c][i]=""+glb["_odata"][c][i]+"";
}

}

}
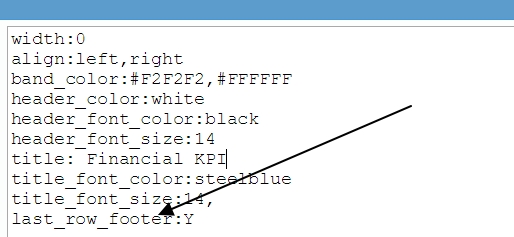
One is to anchor the total row to the bottom so that when you have more number of rows to display the total row will always be visible.
Double click the html grid and it will open the properties
This was a quick tutorial on how to use SQL queries or stored procedure to build HTML grid table displaying information on the dashboard