
This is a fun visualization using the power of D3 library
InfoCaptor has this custom draw widget that lets you embed any HTML and external javascript. Using either the HTML widget or this custom draw widget we can use external libraries to build some cool visualizations.
The HTML widget is pure static, means whatever html you feed it will take and display in the page.
The custom draw widget is very similar to html but it has added advantage. It has access to the data from the connection service.
So practically you can query your database, get the data and feed to the d3js library for building cool visualizations.
Using the awesome d3 library we built this clocks, analog clock displays that can be used on any dashboard page, one for each timezone.
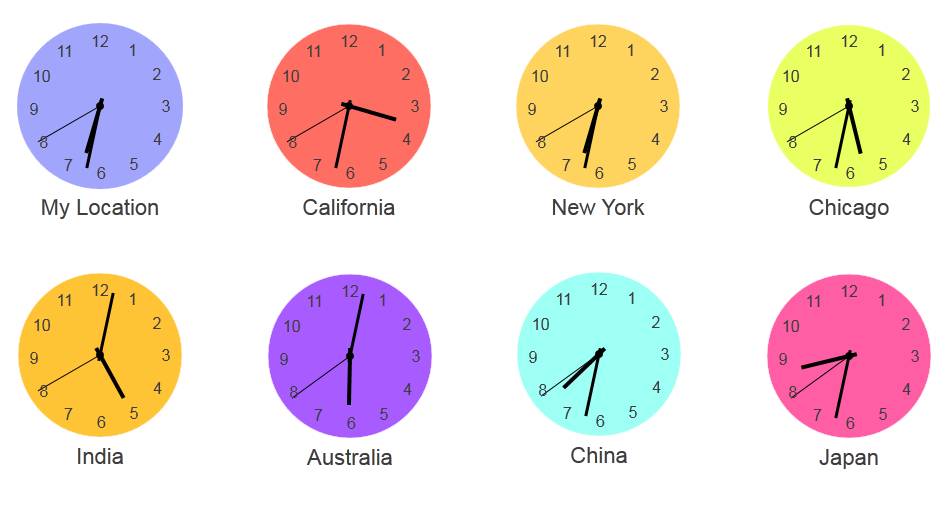
Version 1 : Here is the d3 analog clock dashboard
Version 2 : Here is the d3 analog clock dashboard – part 2
The clock code is adapted from this great tutorial on d3 clock – ericbullington.com
Get the Javascript Code for the analog clock
Version 2

https://my.infocaptor.com/dash/mt.php?pa=world_clocks_using_d3_part2_511031bc87e14
Here is a quick video on how to add clock visualization to your dashboard