
WooCommerce is an amazing tool for those wanting to start their own eCommerce business. If you’re a user (or if you’re thinking of making the switch) you’re probably already aware of its handy ability to host and sell your products in a simple and customizable way. But did you know that WooCommerce can also help you increase sales, grow the number of visitors to your site, and boost your business?
In fact, it can do all this and more—you just have to know how to use it. The secret? Analytics, dashboard metrics, and understanding customer behavior.
Analytics and metrics are some of the most important tools a business can have access to. Knowledge is power, and the more you can learn about your customers, the more successful your business will be. It’s lucky, then, that the WooCommerce dashboard features a number of different metrics and figures to help you better figure out your customer base.
First, you need to learn what these are, how to read them, and the best way to utilize them to your advantage. Read on to find out more.
Table of Contents
What Is WooCommerce?
Let’s start off with the basics. What exactly is WooCommerce, and who might want to use it? WooCommerce is an exceedingly popular plugin that can turn any WordPress site into an eCommerce store.
It was launched in 2008 as WooThemes and it was in 2017 that it pivoted fully toward the world of eCommerce. Since then, it has become beloved the world over for its scalability, its ease of use, and its open-source nature.
Today, the WooCommerce plugin has been downloaded around 40 million times. It is popular among small and medium business owners who want to set up an eCommerce site in a quick and easy manner.
If you’re looking to set up an online store, like working with WordPress, and are looking for a flexible solution that is easily customizable, then WooCommerce will be of interest to you. Because it is open-source, it is exceptionally easy to tailor to whatever needs you may have—especially if you have coding knowledge.
The WooCommerce Dashboard: A Seller’s Best Friend
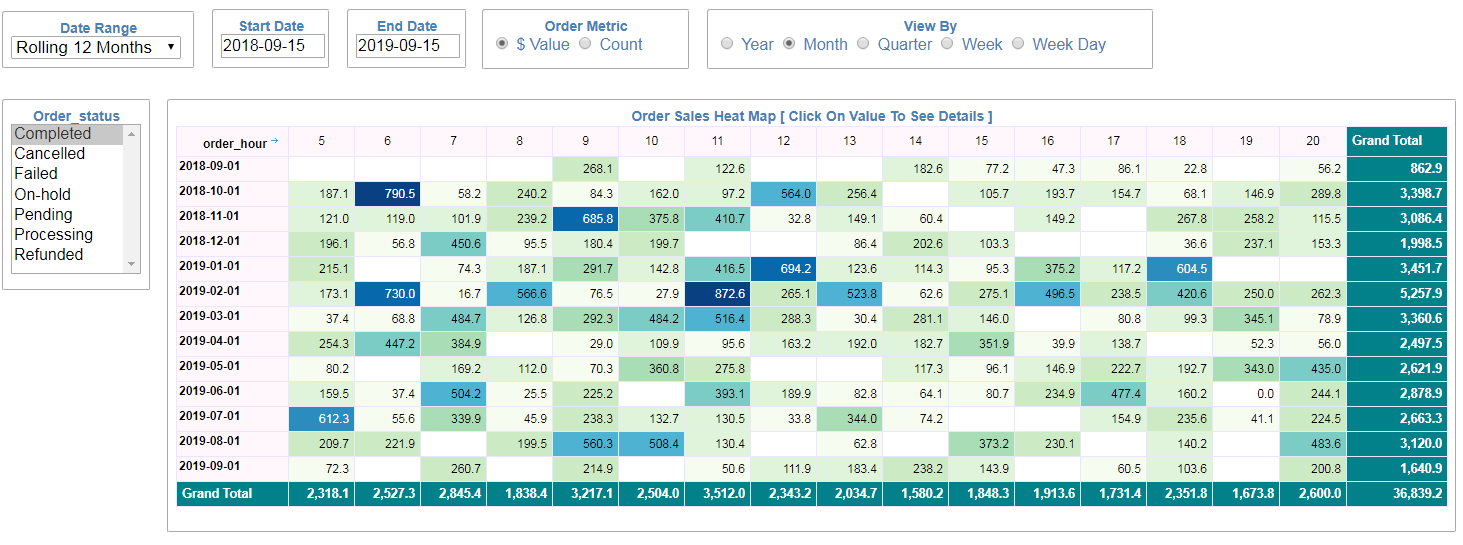
Once you have your online store up and running, you’ve made a few sales, and you’ve gotten to grips with how the plugin works, you’ll be ready to check out the WooCommerce dashboard. The dashboard is the place where all the valuable customer, sales, and product data are held. These metrics can be used to your advantage, but without the proper knowledge, they’re just a bunch of numbers on a page.
To unlock their full potential, you’ll need to learn which ones are important and how to read them. Website analytics are powerful because they tell a story. They give you a more detailed picture of how your business is progressing and let you see behind-the-scenes information that can help you make smarter decisions for your business.
There are several metrics you should keep a special eye on. Although the most crucial data may differ depending on what kind of store you own, there are some that are always good to track. Below you’ll find examples of some of the most important analytics and what exactly they can tell you.
Sales KPIs
Of course, your sales are a huge—if not the most important—part of your business. Everything you work for is to grow your customer base and increase sales, so you’ll definitely want to keep on top of all of the data surrounding them. There are many different ways you can use sales KPIs to gain insights into your business.
Identify trends in your sales by comparing different months and years. Do you sell better on the east coast than on the west? Are you selling much more in October than in February?
If so—why is this?
Did you run a competition that month? Are your items of a seasonal nature? Did you receive a shoutout from a popular social media page?
By seeing when and where your sales are high (and low) you can capitalize on the good times and make an effort to boost sales in the downtimes. Having an overview of your sales like this is invaluable to your overall sales and marketing strategies.
Top Customers
Another really valuable insight you can gain is who your top customers are. Your dashboard will allow you to see a list of who the big spenders are on your site. There are many things you can do with this information.
The first thing you can do is find out more about them. You can send them an email thanking them for their custom and asking them to fill out a short survey. This can help you determine a) what kind of people are buying your products and b) what they like about your store—and what your store could be doing better.
It can also be a good idea to offer your large or loyal customers special gifts or incentives, to encourage repeat business. Send them discount codes or a free product as a token of your gratitude. One survey found that 90% of customers said a free gift helped to increase brand loyalty so it’s clearly a strategy that works.
Most Popular Products
With the WooCommerce dashboard, you can see both which of your store’s categories and products are the biggest sellers. With this information, you can get a better handle on what to stock, which products to push, and what your customers want.
You can predict which items will sell well at a particular time and compare a certain period’s sales to another to identify trends. You can also use this information to determine which types of products you should be stocking more of and which product categories you should be focusing on. This information is powerful as it can inform your buying strategy, reduce the number of order delays you have, and stop you from having wasted stock.
Dashboard Metrics That Matter
Of course, these are only a few of the WooCommerce dashboard metrics you may want to check out. No matter what analytics you want to take a closer look at, InfoCaptor can help you make sense of the information and make the metrics easier to understand. Get in touch today to learn more about our product.