In this article we will analyze the crash and accident data from the NHTSA website
The data is provided by year and the time of the day. So going by the hunch, the accidents related to alcohol should be very high during the night time and less during the working hours.
Plotting this data we get
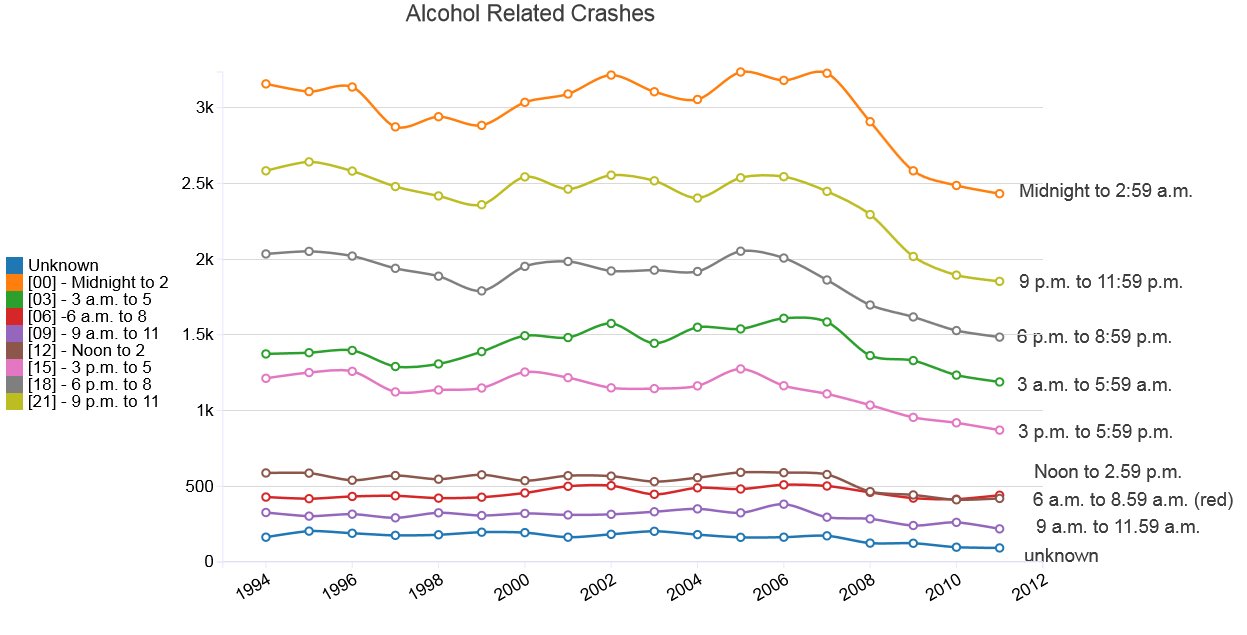
The peak occurs between midnight and 3pm.
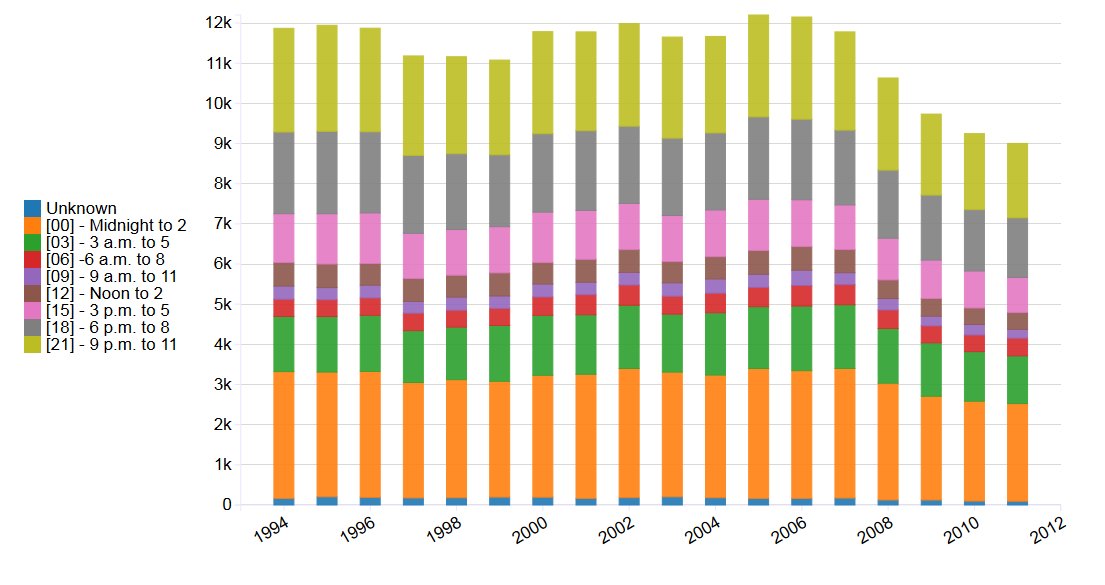
Now let us see how the trend is changing over the years
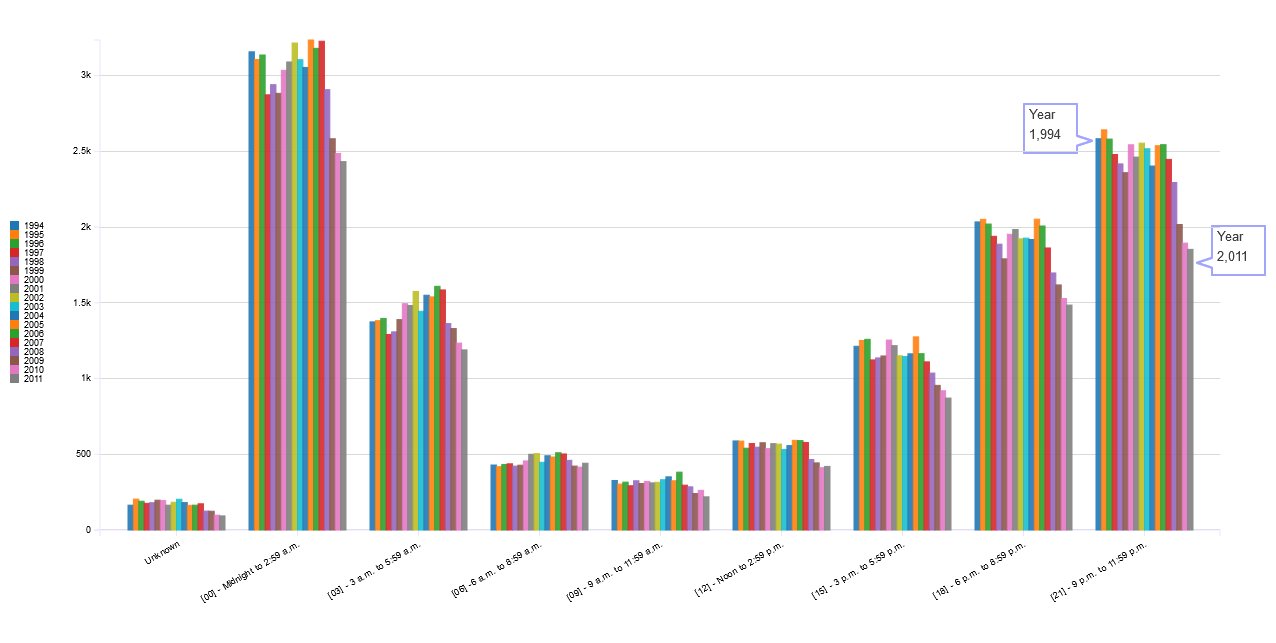
In the above chart, each bar represents the year and you can see within each time slot how the trend is falling down. The right most bar represents 2011 and left most represents the year 1994.
And here is another view
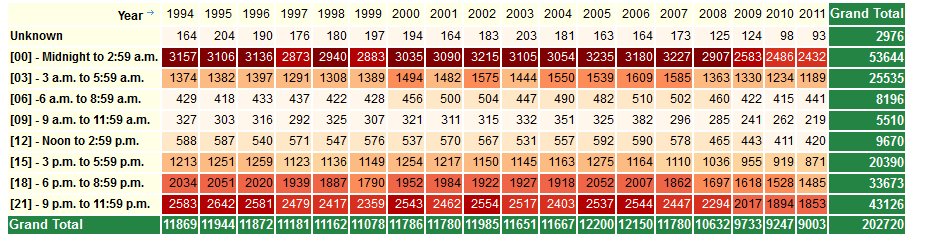
Here is how the data looks and it is provided by year.