
For a startup or small business it is very important to track certain things apart from revenues and expenses.
A startup could be selling a subscription service, a downloadable component, mobile app and so on.
A startup also has raised some funds either through family/friends or incubator and VCs
A startup is attacking on various fronts to gain traction. It outsources some marketing, does some inhouse SEO, does in-house Social media marketing.
A startup is trying to lay the foundation brick by brick for this multi-dimensional structure.
This is true for a small business as well but for a startup it is all accelerated motion. Every thing is moving extremely fast.
It has to keep doing things it did yesterday and tomorrow it has to add new things to it.
Remember the key is “growth” and this requires cumulative increase in the amount of efforts.
To bring some sanity in this whole startup thing, we built this simple “Startup Scorecard”
Here is how it looks. Yes we copied the Windows 8 style for this dashboard.
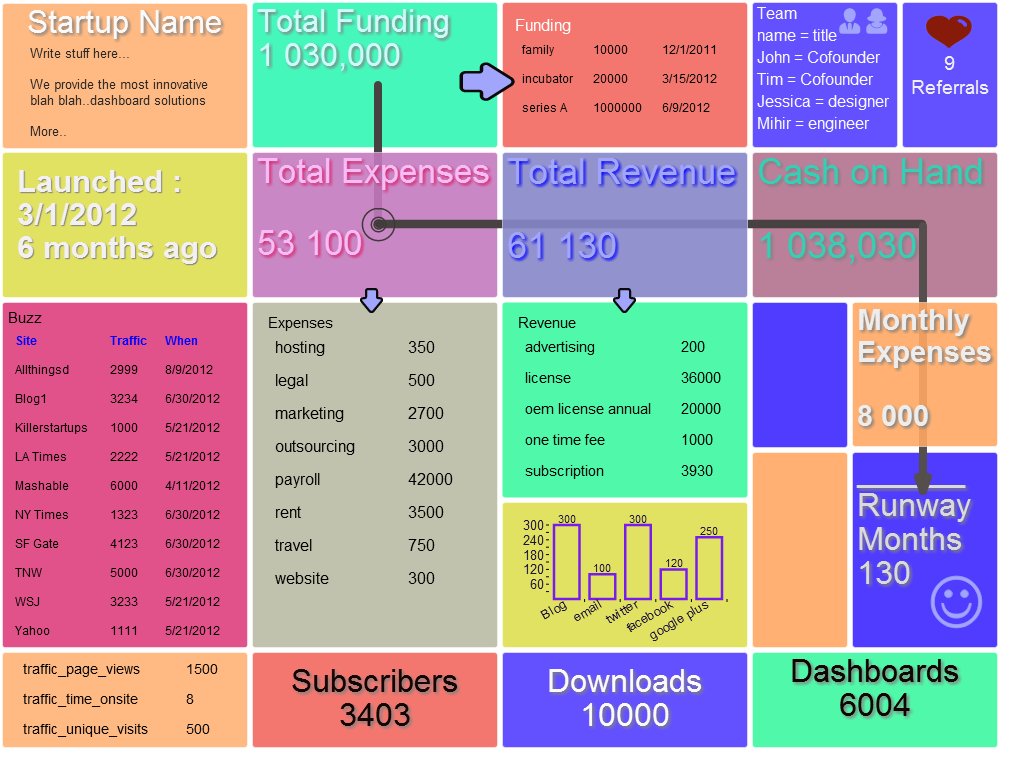
What is this “Startup Scorecard”?
In short, it is just a template and a quick starter dashboard to track things that matter.
How does it work?
Each window represents certain information. You can clone these windows to add new stuff or delete that you don’t need.
Each window is sourced from Google spreadsheet. But this data can come from any data source like Excel files or a real database.
But we also built this Google spreadsheet startup template to go along with it. The idea is to get you started with this dashboard in no time. Later we will give you the exact steps to replicate this dashboard to track your own stuff. You simply fill up the google spreadsheet, point this spreadsheet to the dashboard and refresh. That is all it takes to get the same view for your own startup.
What are the benefits
- Birds eye view of your critical operations
- Use this as a deck slide when pitching to investors or while presentations
How do I Use it
- Copy/clone this google spreadsheet
- Go to this Dashboard templates
- Click on “01 Startup Dashboard”
- Go to the top right menu bar
- Click Export >> Export Page/selected objects
- Copy the entire text code
- Create your account or Login
- Go to the top right menu bar
- Click Export >> Import Page
The above steps bring the dashboard into your account.
How do I make it use my data
There are two ways to enter data into the dashboard
The dashboard by default maintains its own database so you can simply double click on any widget or grid component and punch your data directly in it.
The second approach is to source it from a spreadsheet or database.
Right click on each widget and change the google spreadsheet key in the parameters section.
Check this tutorial on how to use google spreadsheet as dashboard source
We hope this quick setup will help you bring some sanity on your startup activities.
How to Export/Import Dashboard
InfoCaptor Export Import Dashboards from InfoCaptor on Vimeo.