
In this analysis we gather data from CDC for Marriage and Divorce rates across all the states of USA for past several years. As usual the bulk of the time is consumed in the data gathering, munging and preparation step for the analysis.
All the data for each year is manually copy/pasted from the website into excel and then we mix the data with census to derive the states Census regions. This allows us to compare the marriage and divorce rates by the Census regions. Later, you can see the complete development process in the video link at the bottom of this analysis.
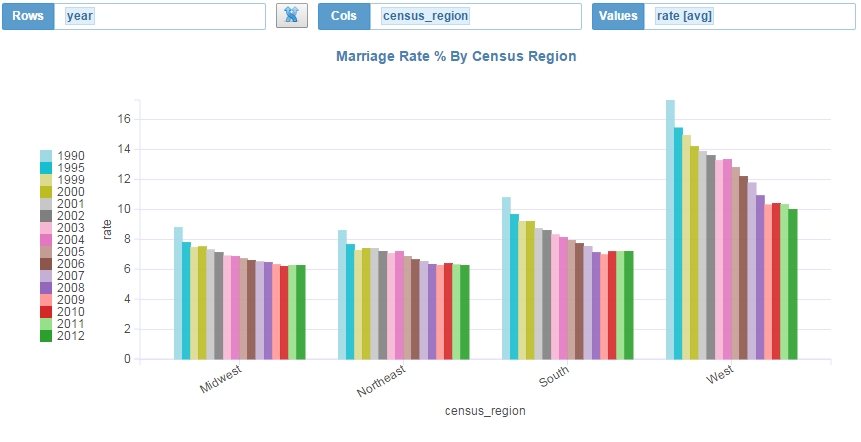
Let us see the average trend by the Census Regions
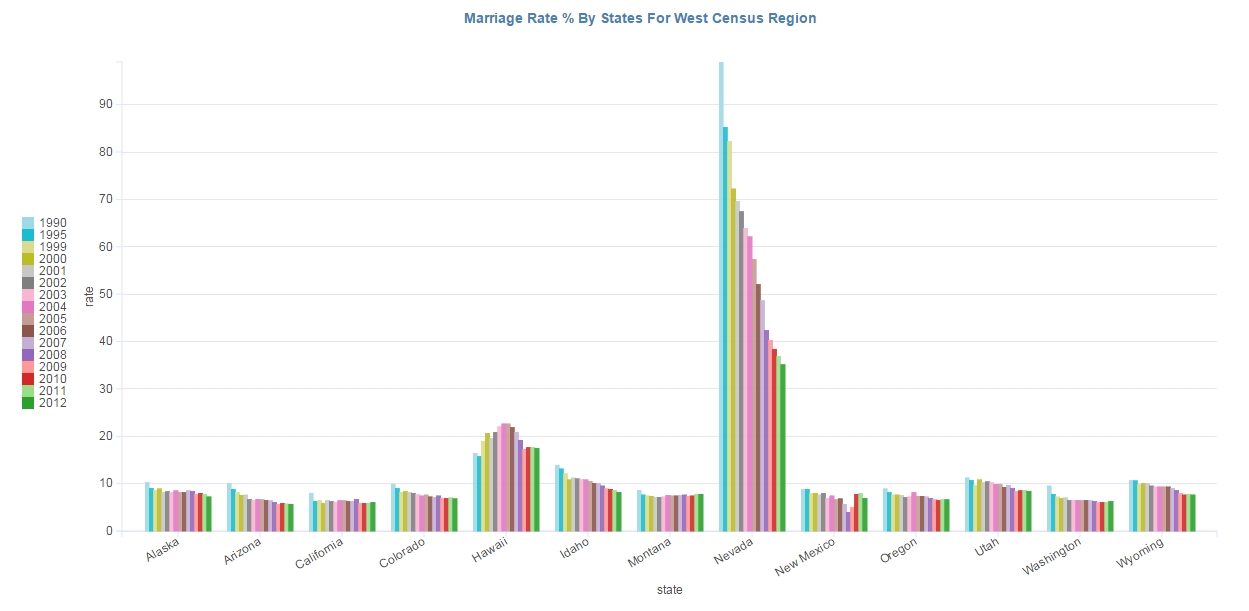
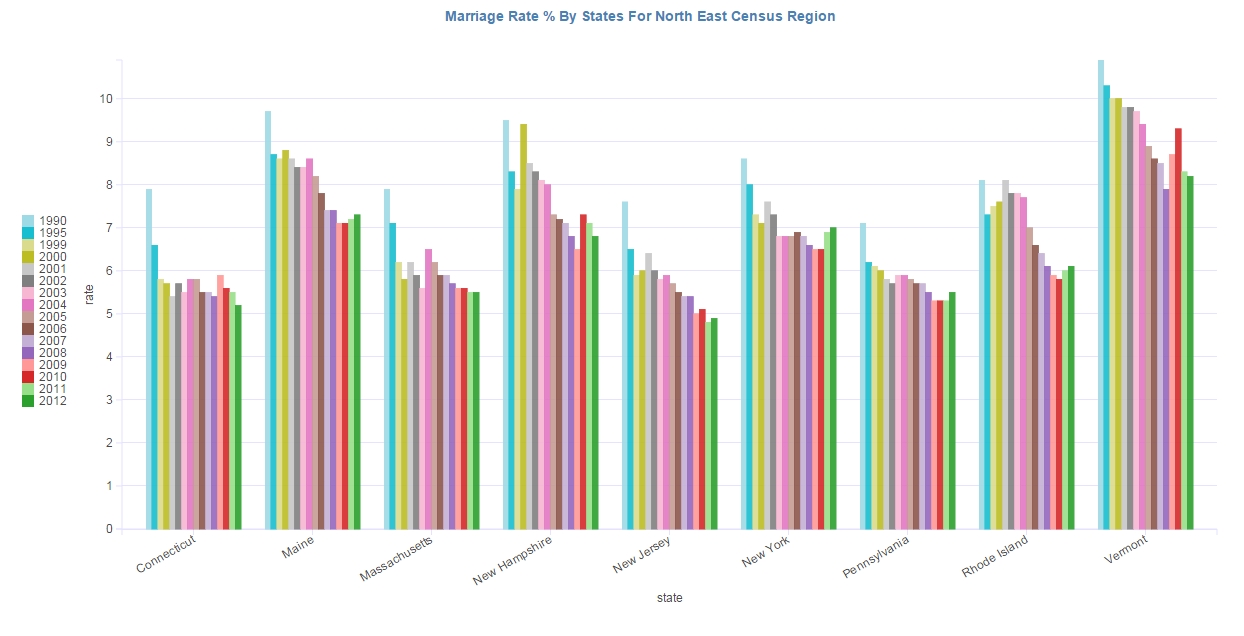
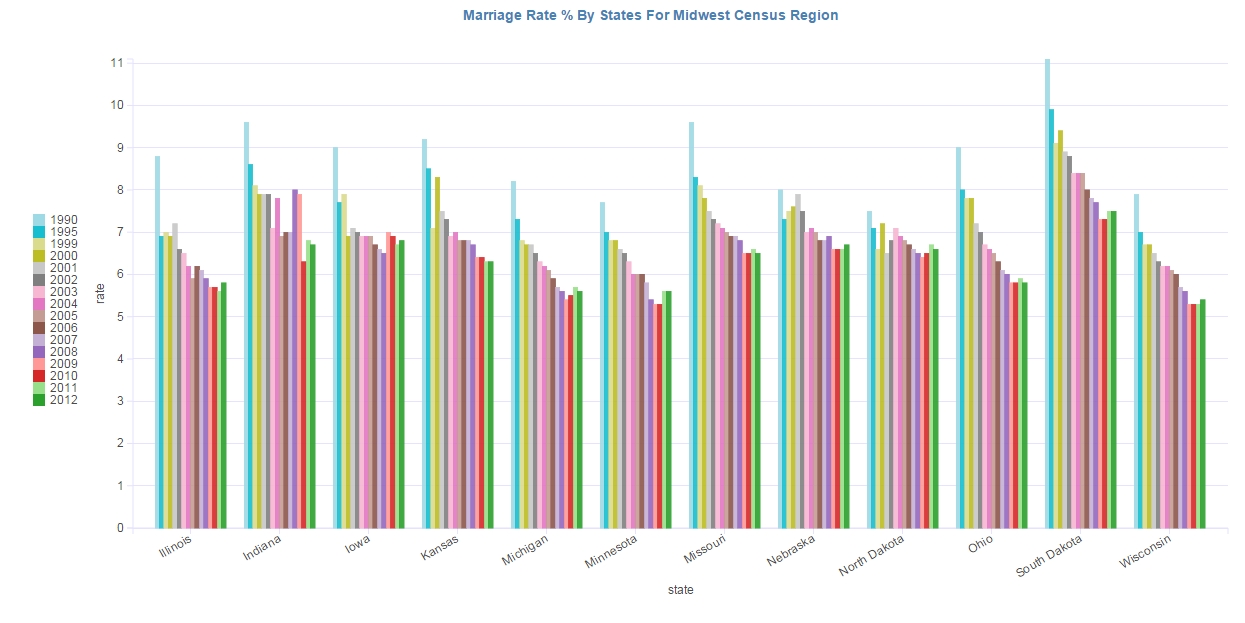
1. Marriage rates by Census region
The following trend line compares the marriage and divorce rates
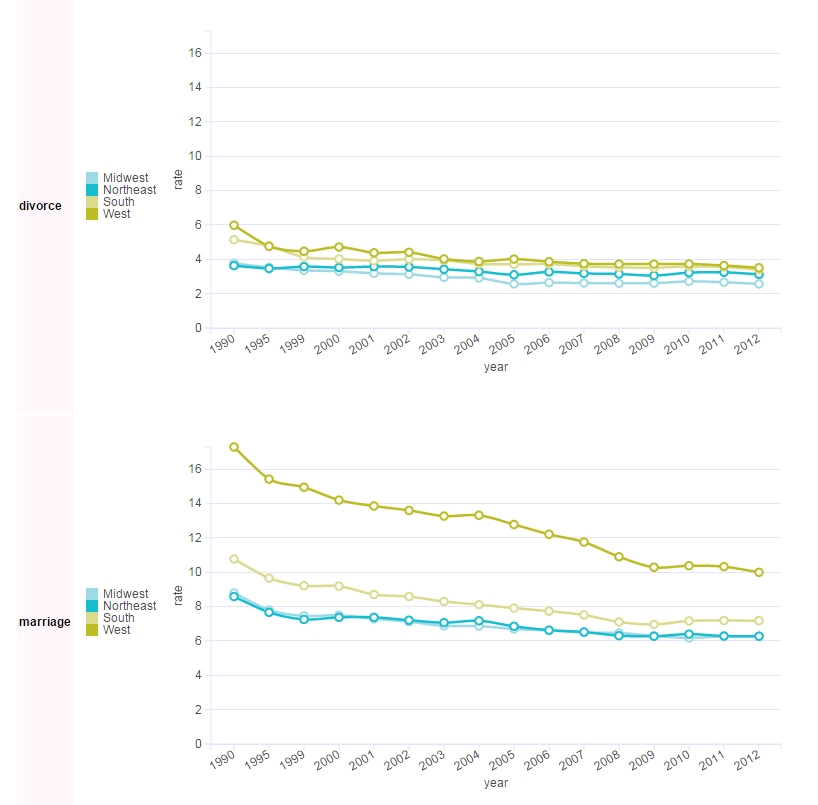
Observations
- Marriage rates for Northeast and Midwest follows the same trend.
- Marriage rates have been declining
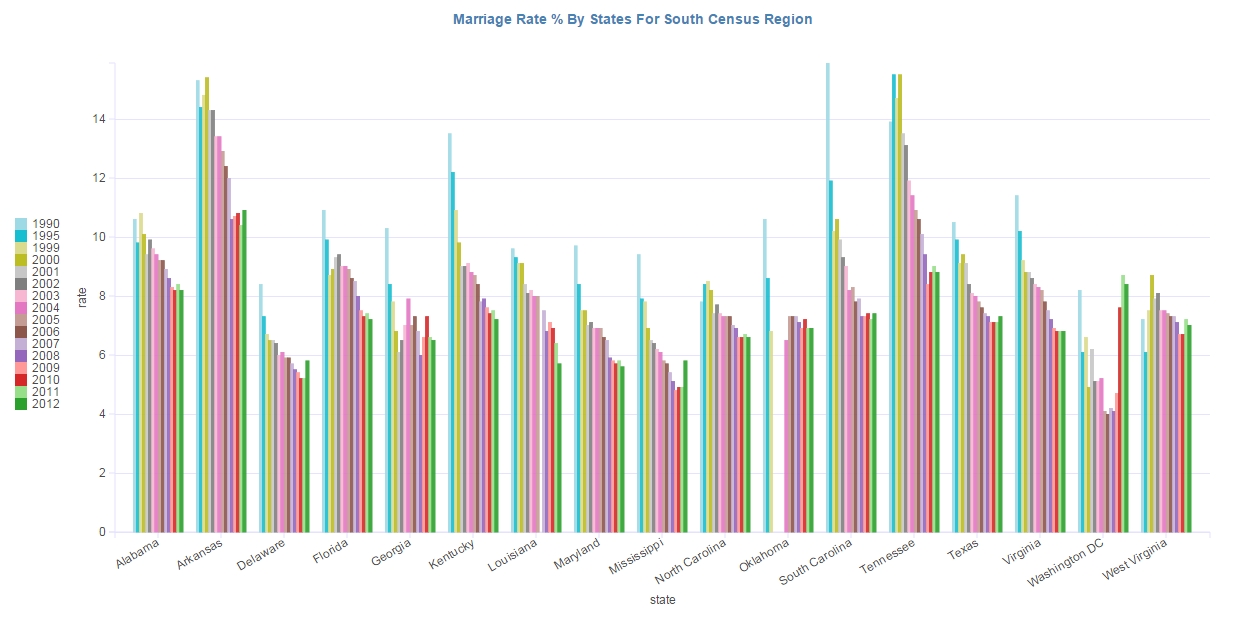
Next, we analyze the marriage and divorce rates by each state.
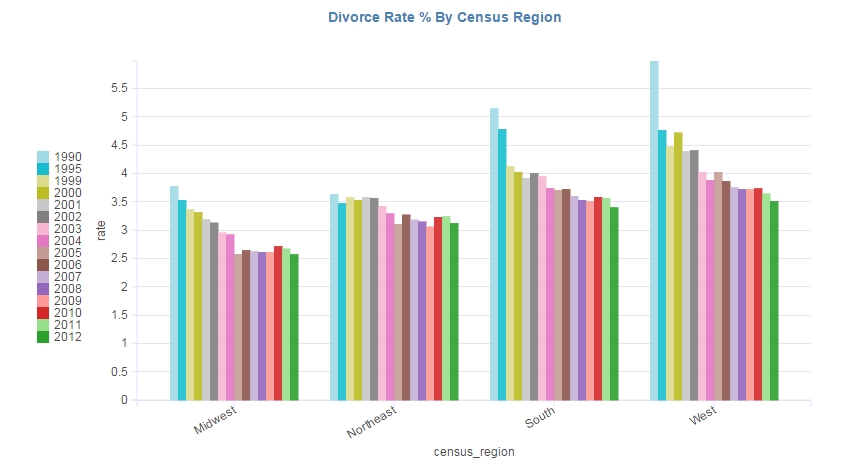
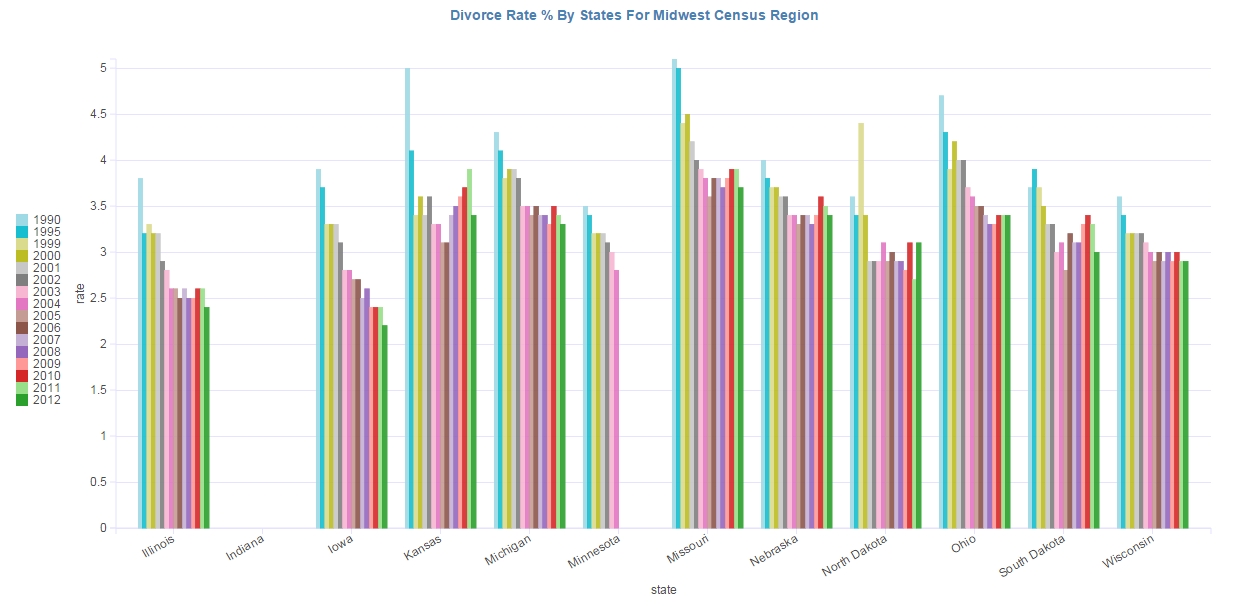
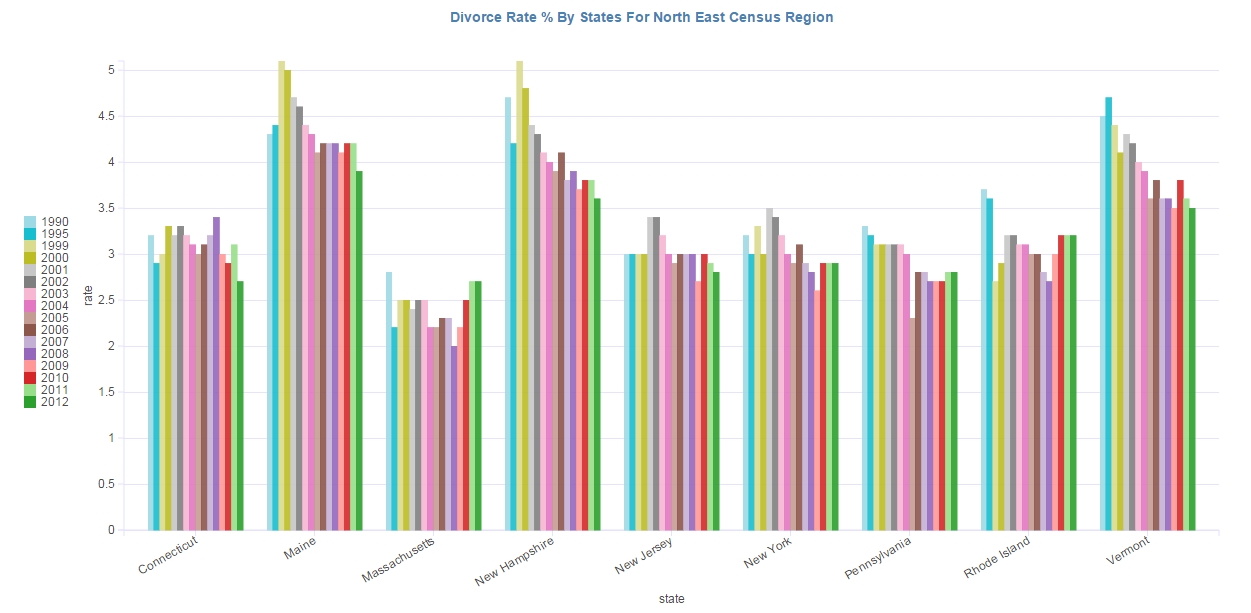
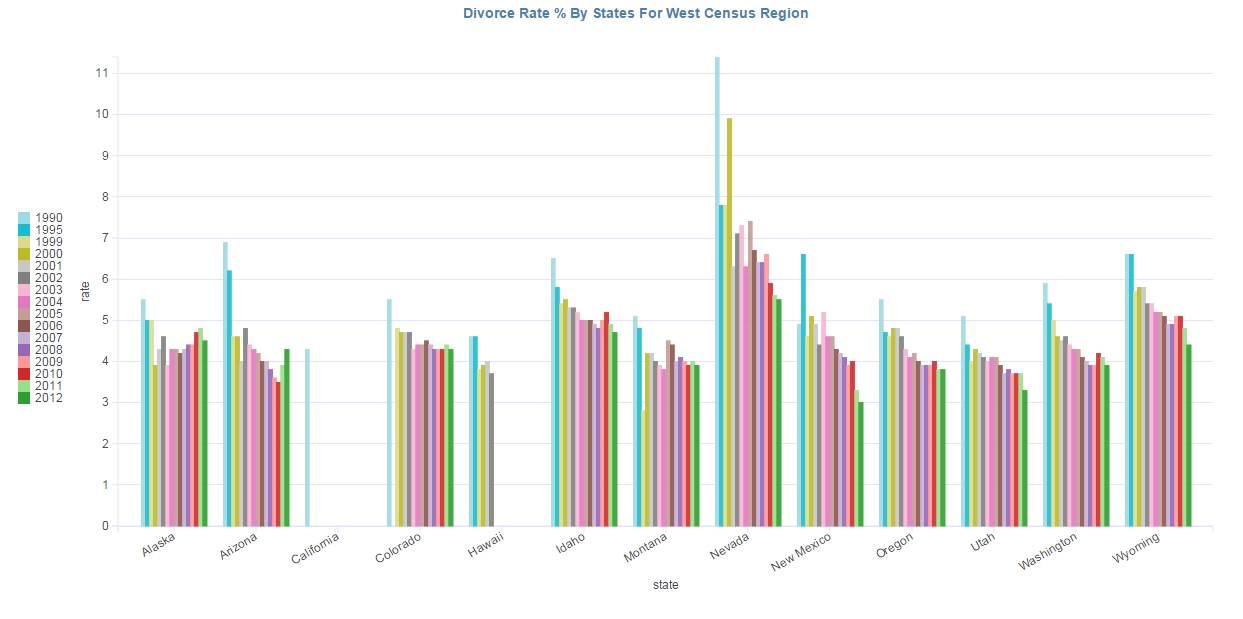
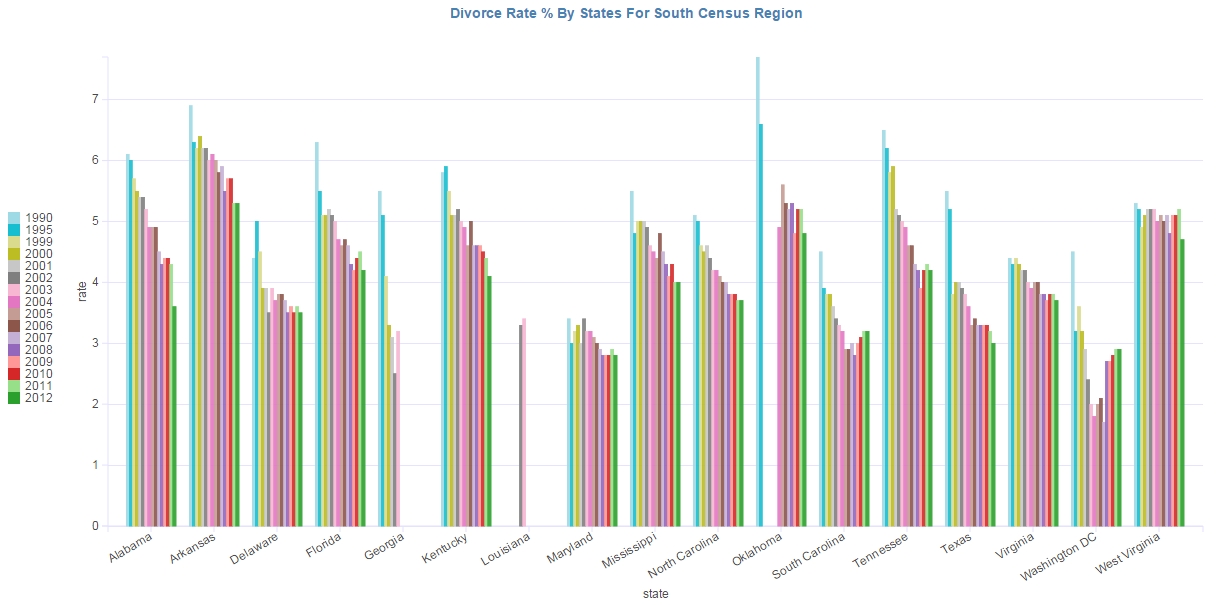
Next, we analyze the Divorce rates.
Complete development process
You can watch the complete dashboard building process in this video
To watch the rates for all Stats at once, you can play with this prebuilt dashboard Marriage and Divorce Dashboard.