InfoCaptor has powerful visualization engine that does pivot tables just like Microsoft Excel.
The complete visualizer is built on the concept of pivot tables.
When you are displaying a simple table grid, then sorting is very easy to specify. There are only two ways you can sort a column based tabular grid.
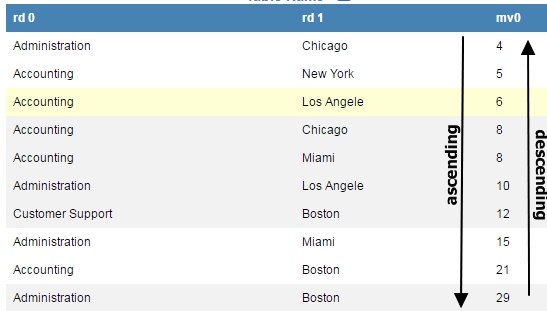
In a normal grid like above, you sort the columns either ascending or descending.
In a pivot table, the combination of sorting increases and let us illustrate this using following examples
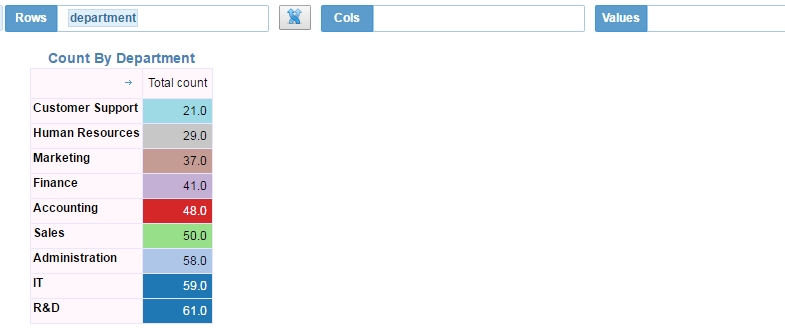
This is a simple pivot with just one dimension in the row bucket
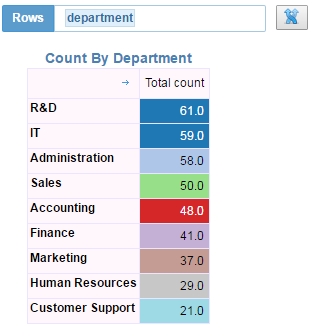
By default it is sorted by descending order on the first metric
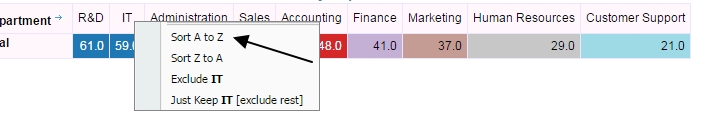
When you right click on the metric column, you get 4 different sorting options
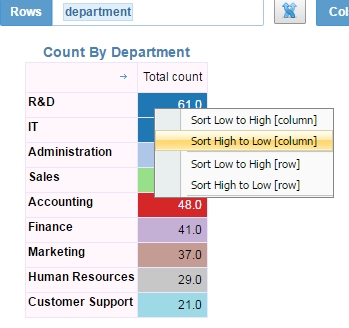
The top two options are for column based sorting and the bottom two are for row based sorting.
Sorting “High to Low[column]” gives descending order and vice versa.
The bottom two options by row are not relevant becase we do not have anything in the column bucket yet
Let us move the dimension to the Column bucket
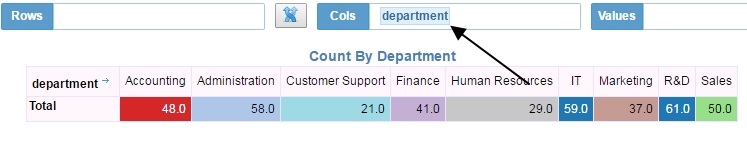
As you notice, the departments are sorted alphabetically. We can change this by right click and then select the sort option.
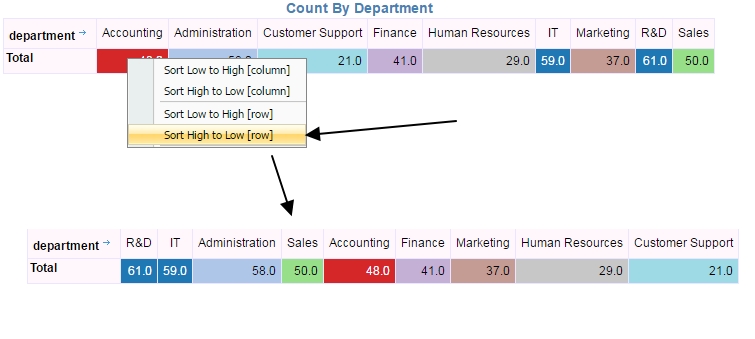
Another sorting is available on the dimension members. For dimensions only alphabetical sorting is provided.