
Scenario: You have built a dashboard on a development database connection and you need to migrate to a production server using production database. How do you change the connection on the dashboard charts and visualization?
There are two ways to change/update connection settings.
Method 1
1. Let say you created a connection handle mydb_dev and built your dashboard.
2. You can create another connection handle mydb_prod and go to the dashboard and edit each chart.
Right click on the chart and select “Data Source”
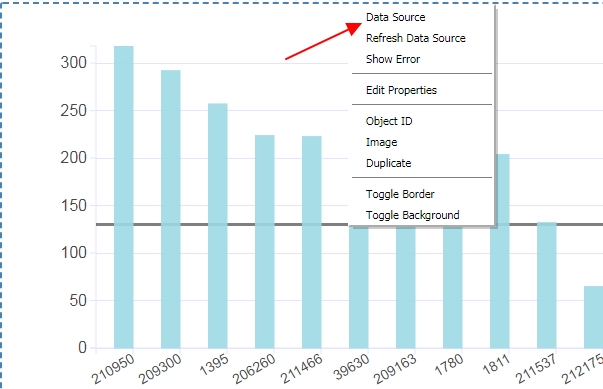
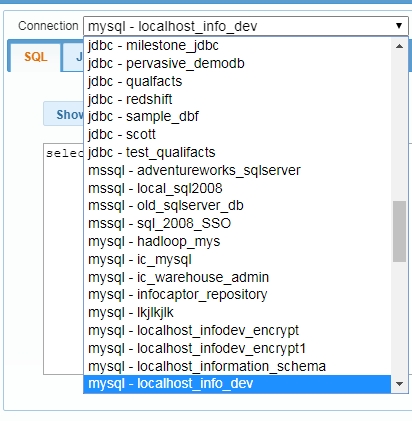
In the list of connections, pick the connection you want to replace with.
Before you replace the connection, you need to make sure with your Database administration that the same tables or views are accessible using the new connection or else you will see errors fetching data into the visualization.
This is a straightforward replace of one connection with other. If you have many charts or widgets on the dashboard then you will need to go into each one and perform the same replace action.
2. Method Two
This method is applicable in scenarios where you want to replace the server details or maybe the old server is no longer valid. In such scenario you siliently replace the connection itself without changing the dashboard.
The second method is to go back to the connections page and re-create the connection handle with the same name and new server details.
Let say the original connection was “mydashboard_db” handle
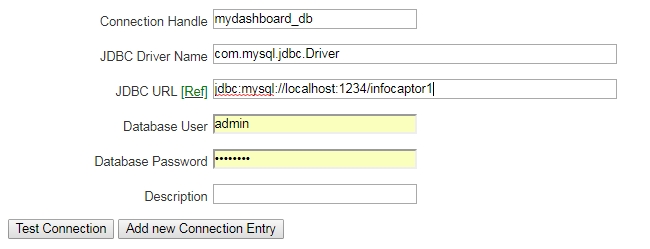
This handle was connecting to infocaptor1 db at port 1234.
You need to switch to a different database infocaptor2 at port 5432
The trick is to use the same connection handle name and replace the driver/URL or any other detail that is necessary. InfoCaptor will replace the underlying information and keep the same database handle.
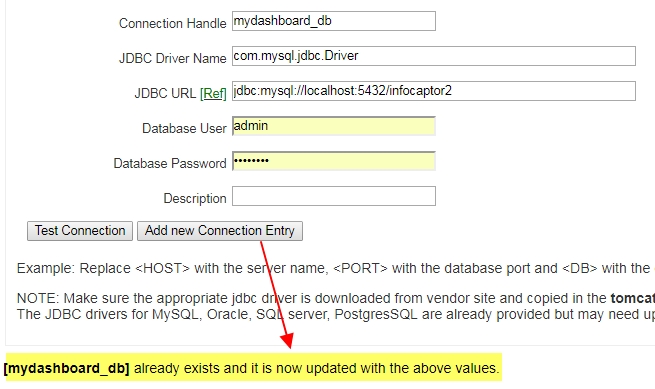
Once you click on “Add new connection Entry”, it will notice that the connection handle already exists and will replace/update the settings.
Now when you refresh the dashboard, it will use the new database.