Veteran Suicide Rates : Visualization using maps

Share on facebook
Share on twitter
Share on linkedin
Share on reddit
Share on email

Following is an alternative visualization to the Veteran Suicide Dataset and visual found at News21

Since the dataset is available by USA state codes, it made sense to use the State cloropleth as below.

Here is the direct link to the Veteran Suicide Visualization Dashboard

Image

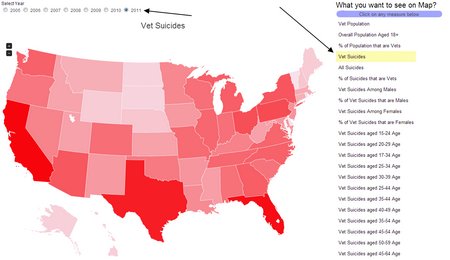
On the top you can select the year and on the right hand side you can select the metric you wish to see on the cloropleth.

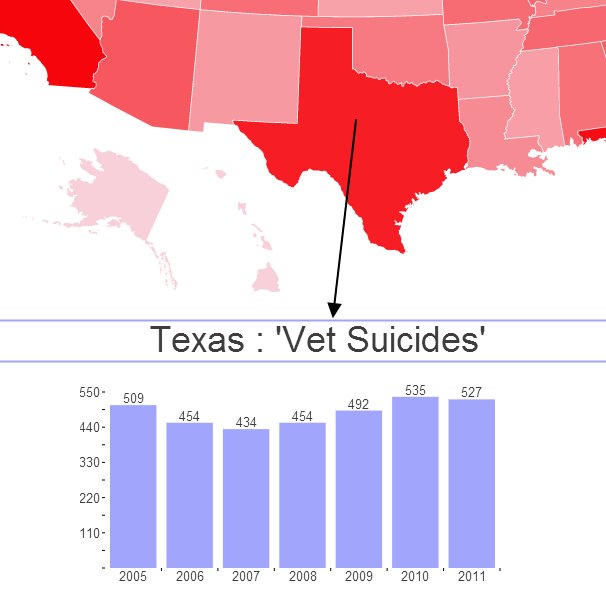
When you click on any of the states, it shows the trending as bar chart just below the map

Image

Link to the dashboard

Learn How to build Maps in few easy steps

The Core Tools

Create dashboard for any Database

Data Visualizer and Dashboard Application
SALE
This is the best dashboard software for its price. One good thing we did was to hire their consulting services to build few dashboard prototypes and provide some quick dashboard training.
- Terry Seal, IL
We evaluated Xcelsius and Qlikview and the cost for organization to implement dashboards was quoted over 10,000 USD. For fraction of the above quoted price, we were able to buy the licenses for the web based dashboard software and get some free training. This is truly a dashboard software for small businesses like us.
IT Manager of a Trucking company, OH