
Data comes from variety of sources. It could be your Excel files, Microsoft Access or real SQL databases like MySQL, Oracle, SQL Server, DB2 etc.
These databases are used to store information from your ERP, MRP, CRM or Datawarehouses. The data is everywhere and the most challenge is how to consolidate all information in few screens so atleast you get a birds-eye-view.
This is where dashboards come to our rescue.
In this tutorial, we will use the free web dashboard service to connect to internal database within any organization.
Very often databases are tied under the IT policies of “no outside access”. If your company is under SOX or other government regulation then getting direct connection to SQL is simply impossible.
In such cases, you can follow all the safe methods of getting a read only database user and grant only select privileges to certain schema or set of tables.
But what do you do when your company simply does not allow any outside connections to internal databases?
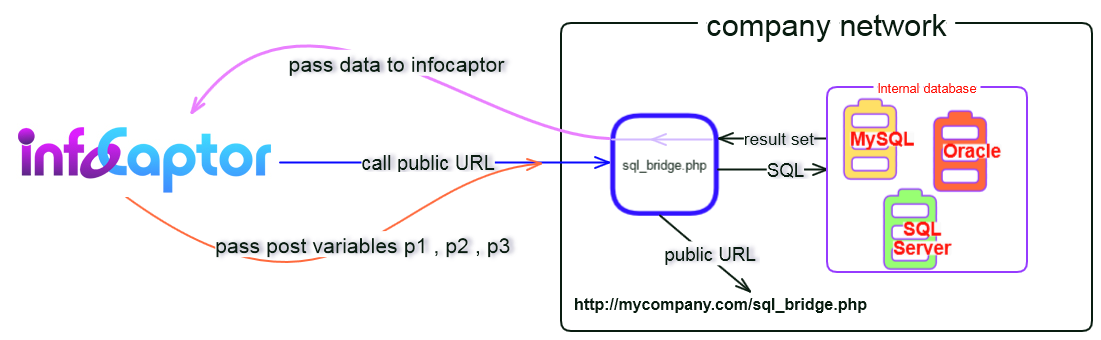
To help with this situation, you can create a SQL-Bridge interface as illustrated in the figure below
Fig 1
Summary of steps
- You can create a web form that stays on your company webserver e.g sql_bridge.php ( you can name it anything you want and use any scripting language)
- This web form accepts POST variables, in our example it takes p1, p2, p3 ( NOTE: you are not limited to just 3 variables, you can have as many post variables as you need)
- This p1, p2, p3 could be anything you want the outside world to pass in order to get information out.
- For e.g p1 = username, p2= secret code, p3=table_name
- InfoCaptor is part of the outside world as it is not hosted in your company network so there is no special provision for it.
- Internally the sql_bridge.php validates p1 and p2 and upon success it will issue SQL statements to the database and fetch results from the table as specified in the p3 variable.
- It then sends the data back to infocaptor.
This way you have created another security layer on top of your database. It is totally upto you how you implement the bridge.
We will demonstrate one real example and how we use the above mechanism with our own SAAS application
We have our MockupTiger web application https://www.wireframes.org hosted on a different server than our Dashboard application https://my.infocaptor.com
They both are on different databases and don’t talk to each other and do not have any special back door access.
Internally we have opened up readonly access to MySQL databases that houses our blogs (on mediatemple) so it is easy for us to issue direct SQL commands against our wordpress database but for SAAS applications the databases are sealed off from the outside world.
In order to derive real time metrics from our MockupTiger web app we followed the above approach of HTTP posting + Sql bridge.
How to write the SQL bridge
Here is the detailed procedure.
1. Write the sql_bridge.php code (Get the sample file here)
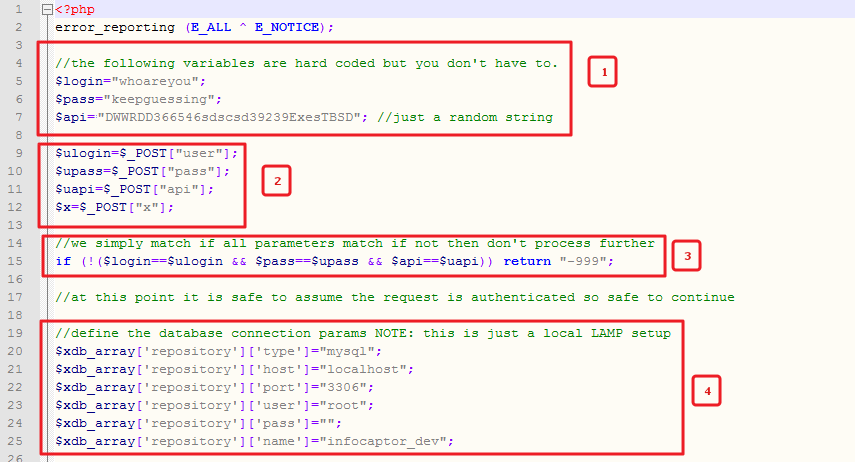
1.1 we define three hard coded variables $login, $pass and $api
1.2 Next, we collect the user submitted POST variables
1.3 We simply validate the POST variable contents to the hard coded values
If they don’t match we do not process further
If they match we continue forward
1.4 We define the database variables for connecting to a MySQL database. You can choose to connect to any database of your choice and implement your own procedure how you connect and talk to it.
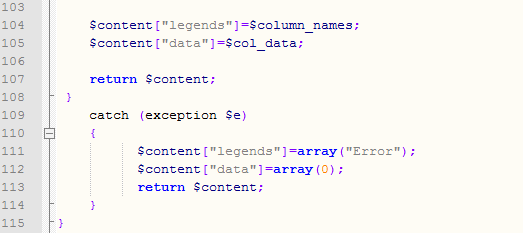
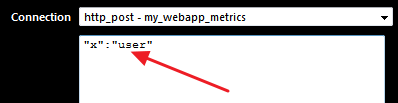
Once authenticated, we intepret another post variable ( $_POST[“x”] ) content to determine what type of data we need to return
Fig 3
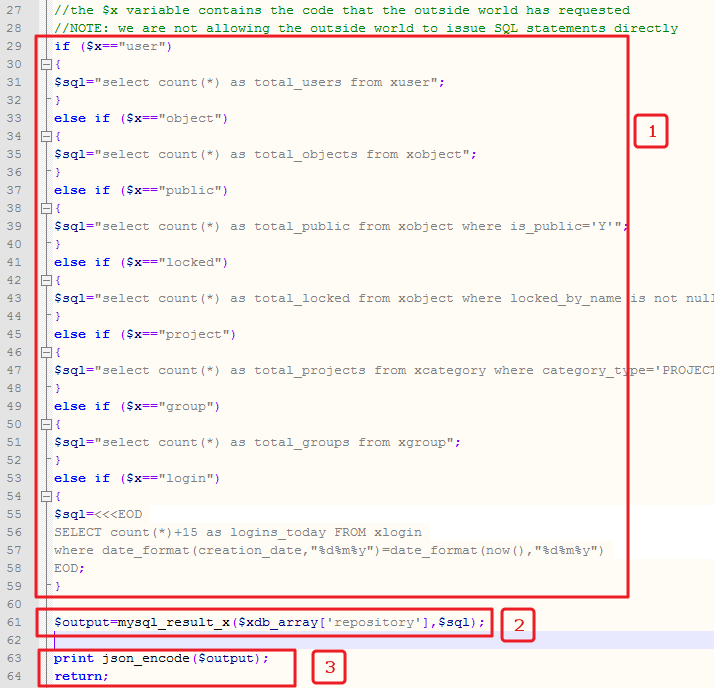
NOTE: We are generating the SQL statements inside our sql_bridge.php file depending on the “x” variable.
In the next step (#2) we call the mysql_result_x with the sql statement and collect the output in the $output variable
Next, we convert the output to JSON and return it to the browser.
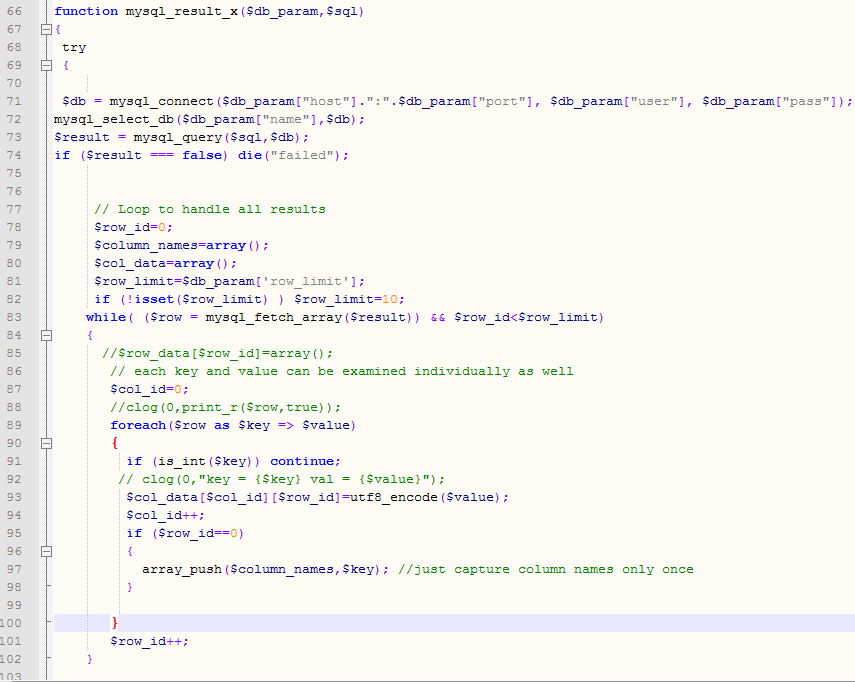
Here is how the mysql routine is defined and you can define your own routine for other databases.
Fig 4
Now we place the sql_bridge.php file on our webserver and maybe bury it under a sub-directory.
In this tutorial, we simply placed it in subdirectory named “restricted”
By calling this URL it shows blank page, no information is revealed.
Now we define this URL within infocaptor so it can securely pass the POST variables and display data on the dashboard
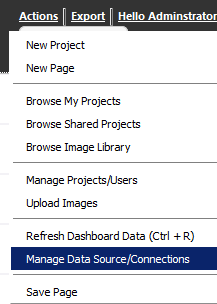
How to define connection for HTTP Post within InfoCaptor
Within InfoCaptor – Goto Actions and select “Manage Data Sources/Connections”
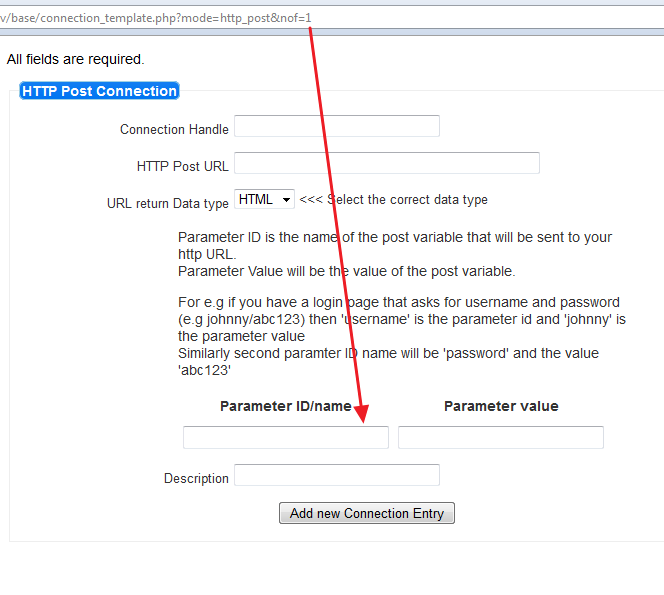
The connection definition URL accepts the number of fields (nof) variable for http post

If you don’t specify nof value then the default value is 3 POST parameters
For e.g if you specify nof=1 then only one parameter name/value pair can be defined
In our case we need only three post variables User, Password and API
But wait, don’t we need one more post variable for the “x”?
You are right but we don’t need to define it here and will address that shortly
Let us define our connection for HTTP post
Fig 5
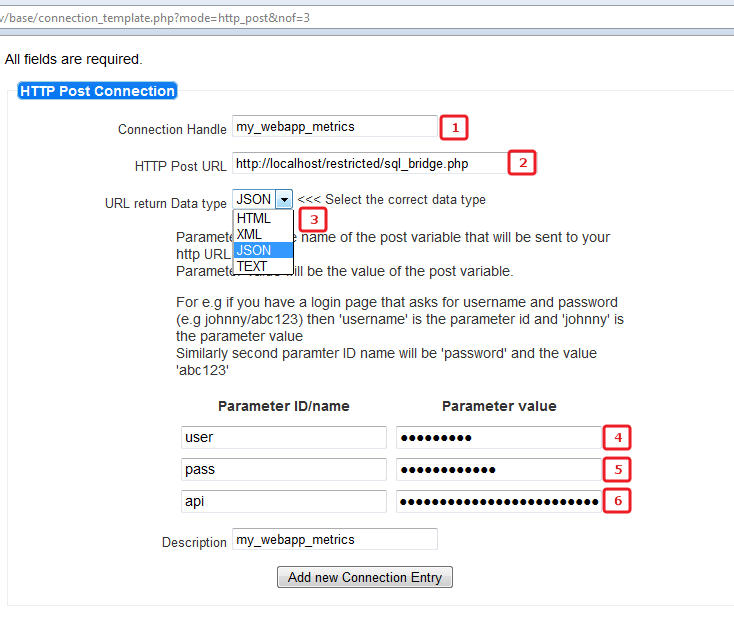
1. Give a appropriate connection handle (my_webapp_metrics)
2. Provide the HTTP URL (localhost/restricted/sql_bridge.php)
3. Select output Data type. We know that sql_bridge.php returns JSON data (see Fig 3 , bullet point #3)
4. Parameter name = user and Parameter Value = whoareyou
5. Parameter name = pass and Parameter Value =keepguessing
4. Parameter name = api and Parameter Value = DWWRDD366546sdscsd39239ExesTBSD
Click on “Add new Connection Entry”

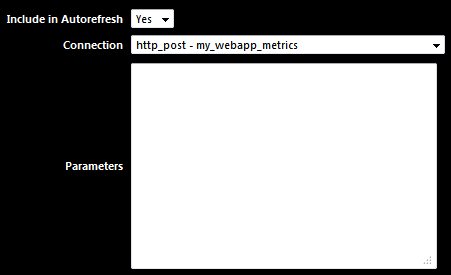
Now we can use this connection handle inside our dashboard widgets.
1. Create a new page
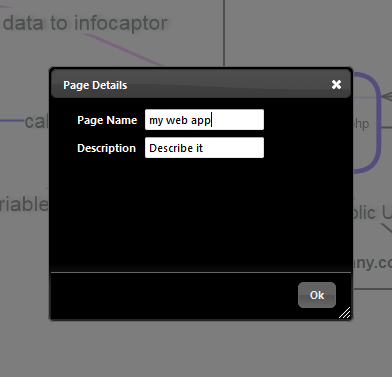
Since we know that we are getting only count values we can display them on the icon widgets
2. Drag four icons to the canvas (we just chose the rounded squares)

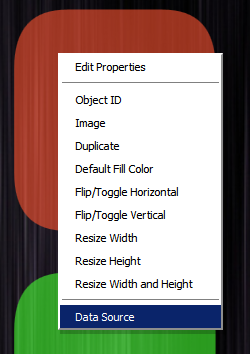
3. Right click on the first one and select “Data Source”

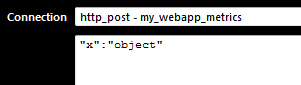

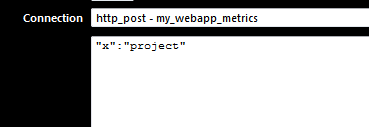

-
HTTP Post is a powerful way to interface any system
-
Pass any number of post variables
-
Define custom post variables on the fly for each widget
-
Output can be html, xml, json or just text
-
Use this method if your database is locked down and you want to limit outside access.