Time-and-again, analytics has been useful in people’s lives, whether it’s in higher education, marketing, the health sector, or in energy and utility services. The last one, however, is still in a major upheaval because of the introduction of the latest technologies to measure utility and provide more accurate energy readings. But if used properly, the data from analytics can prove to be reliable sources of insights for the proposal of new energy utilization schemes and gaps in the supply and demand chain.
The benefits and use of analytics for energy and utility do not entirely differ from those in the marketing, higher education, and public health service. Data taken from the analytics reveal a lot about consumer behavior, which is then an important facet in businesses and public service.
For example, energy-providing companies can pool together the data from surveys and smart devices to define how consumers use energy, and how much energy should cost in a specific area.
Instead of hiring manpower to do this analysis for your company, you may rely on an employee or two to encode or track the data. The rest is for the automated system to process.
Meanwhile, here are the other benefits and use of analytics for energy and utility:
1. Energy companies may conduct load management and dynamic forecasting. Dynamic is also synonymous to real-time and accurate forecasting for the supply and demand for energy and utility. Consumers can save a lot in terms of energy costs if data would be leveraged. This is likewise a win-win solution for energy and utility companies who want to provide affordable services to their patrons.
2. Problems in wells, power distribution, and grids are quickly identified. Because these issues are noticed early (or at least before they escalate to an unmanageable extent), possible service interruptions are avoided.
3. Through analytics, one can detect losses of energy, especially if it’s of a doubtful nature (i.e. illegal connections and power distributions).
4. Companies provide better management. Think of analytics as your go-to tools to help explain to your clients why energy is higher in a certain month and why the cost of energy is way than what they normally afford. Analytics are also a good source of data for payment history of consumers.
5. Analytics engages customers and enhances customer-company relationship. Customers are known for their questions, that however, legit, and rational, are too demanding and taxing. With analytics, however, there is little room for questions and doubt, as the data are presented in a transparent manner.
6. Consumers will know more about how to properly consume energy and utilities. Even before clients could complain about the skyrocketing energy bill for this month, they will already be enlightened because of the metrics and data on consumer behavior and consumption patterns.
For instance, every summer, people are known to turn their AC units to full blast, and keep them on for more than two hours. The result: A higher electricity bill during the summer. Leading the consumers to the right information lessens chances of “complaints” and the number of unsatisfied clients.
7. Quality of service is improved based on a predictive model. As aforementioned, consumer behavior and patterns may be written and presented in a more digestible form, such as a graph, to illustrate what happens when the weather is scorching and consumers rely on their AC units for refreshment and comfort.
These data can be “re-structured” in such a way that they can almost accurately predict consumer behavioral patterns even without recent data. By merely using the stored data, projections are made and the company could prepare ahead of its competitors. It’s like knowing exactly what consumers prefer even before they voice it out.
8. Data are presented in chunks. The beauty of analytics lies in the micro-segmented data that energy and utility companies allow to include in bills and other documents for public perusal. These data are easy to understand and are meant for dissemination to customers. This way, there is a deeper level of relationship between consumer and company.
The benefits and use of analytics for energy and utility are too many to mention, but one thing is for sure: they are important in today’s fact-finding, data-hungry, and technocratic consumers.

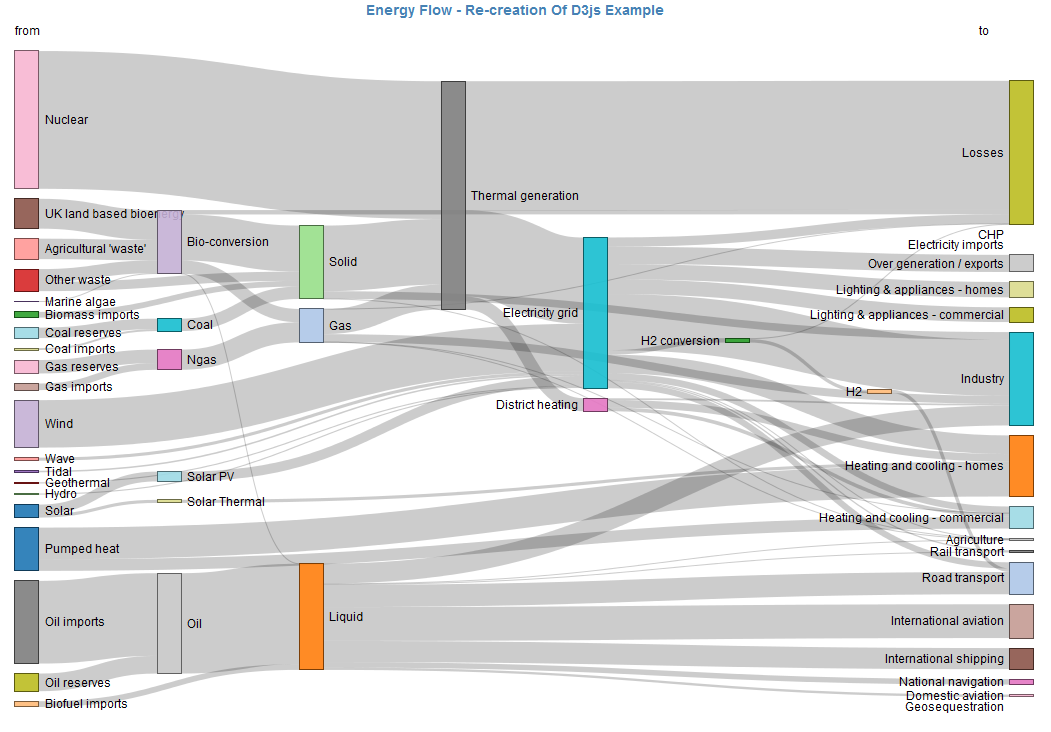
InfoCaptor offers a very powerful tool in the name of Sankey Diagram software that helps visualize various energy flows efficiently.
Building dashboards is a breeze with InfoCaptor, it is the next best thing to Excel dashboards.
