
Introducing brand new Sankey Visualizaton
With the latest release of InfoCaptor, you can build Sankey Diagrams by just drag and drop operations.
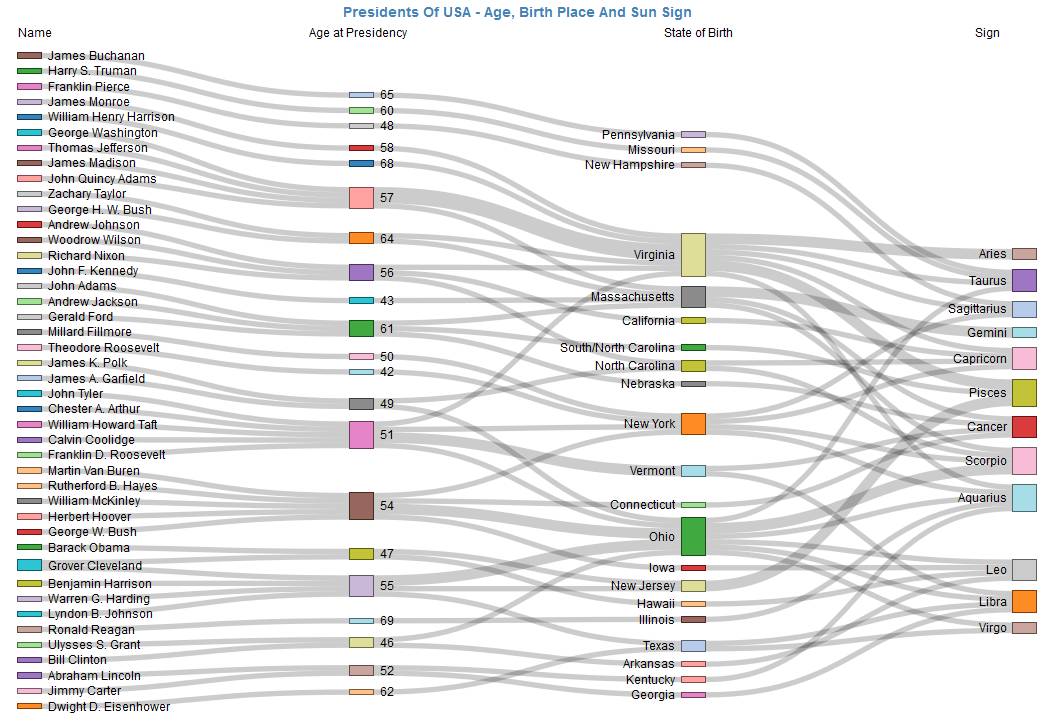
Sankey Visuals are one of the most powerful visualizations. It illustrates flows of any kind, where the width of each flow is based on its quantity. It gives complete bird’s eye view of the system being visualized and at the same time allows the viewer to interact and see the relation between certain nodes in the visualization.
Sankey diagrams can be difficult, frustrating and time-consuming to produce by hand. Until now, it was super frustrating to build sankey diagrams and various flows using flow charting or other specialized software. Just like other complicated hierarchical charts like Circle Pack, Sunburst, Tree Cluster/Dendograms, InfoCaptor has incorporated Sankey as part of the visualization library. What this means is, any user can produce Sankey diagrams by simple drag and drop operations.
The other problem with automated Sankey diagram software, you need to provide data in a special format, you need to clearly mark your from and to nodes. This is greatly simplified within InfoCaptor, all you need to do is provide atleast one dimension and you can generate a Sankey diagram.
Automatic parent child inference
InfoCaptor will automatically detect any parent child relationship and incorporate them into the visualization. Not only that, if there was some problem with data, like Circular loops or Circular references where one child node points back to the parent, InfoCaptor will automatically detect those loops and mark them appropriately in the visualizations.
Sankeys are really powerful and highly engaging visualization. We have create several example visualizations for your visual treat. We will revisit our previously published visualization and see how well they communicate over their counterparts.
Please check this page about Sankey Diagram generator