Small business owners are all about “Getting the biggest bang for the buck”. We as small biz owners want everything to work efficiently and make sure no resources are wasted that includes human resources, time and money.
The question now is “How do you make sure your operation is efficient?” Not by any magic! But you already have the data that can be used to your advantage. Times have changed and Business Intelligence tools are no longer limited to rich corporations. Forget the full Business Intelligence stack, with your data and an easy to use visualization tool can quickly help you deliver “Gold mine” of information.
There is no doubt that the right visualization tools can help small business owners in their way to success. It is just matter of putting your focus on “being more efficient and nimble”. By keeping this sharp focus, you as the owner of your small business can ask several questions like
“How many visitors did I receive last month?”
“How many sales did we receive last week and last month?”
“How much did we spend on advertisement?”
You see, asking questions drives you to find answers through your own data. Visualization tools are perfect to run such quick analysis and get instant answers. Because not every analysis needs to be dashboard, your visualization tool becomes just like your handy calculator on your desk.
So, how can the data visualization help small businesses and what are the main advantages of using analytics and visualizations?
- You can quickly identify what your customers need
Let us imagine that your business is a fashion bags production. Using analytics and visualization may help you to find out which types of bags are being sold first, which colors are more popular and which are not, which size has the biggest demand, etc. Collecting this information may help you to increase the production of the bags that have the most demand and get rid of the non-performing ones.
- You can follow all your marketing campaign results
Google analytics and Google Adwords are tools through which you can track your website traffic and marketing effort. Collecting data from these platforms and visualizing is a valuable process every small biz owner should adopt.
- Correlation
What use does it serve to just analyze your sales and expense data? How about correlate your sales with your marketing campaigns, website traffic? Isn’t that more effective and get you clear insights into your operations?
Don’t let your precious data stagnate in Excel and Google Spreadsheet!
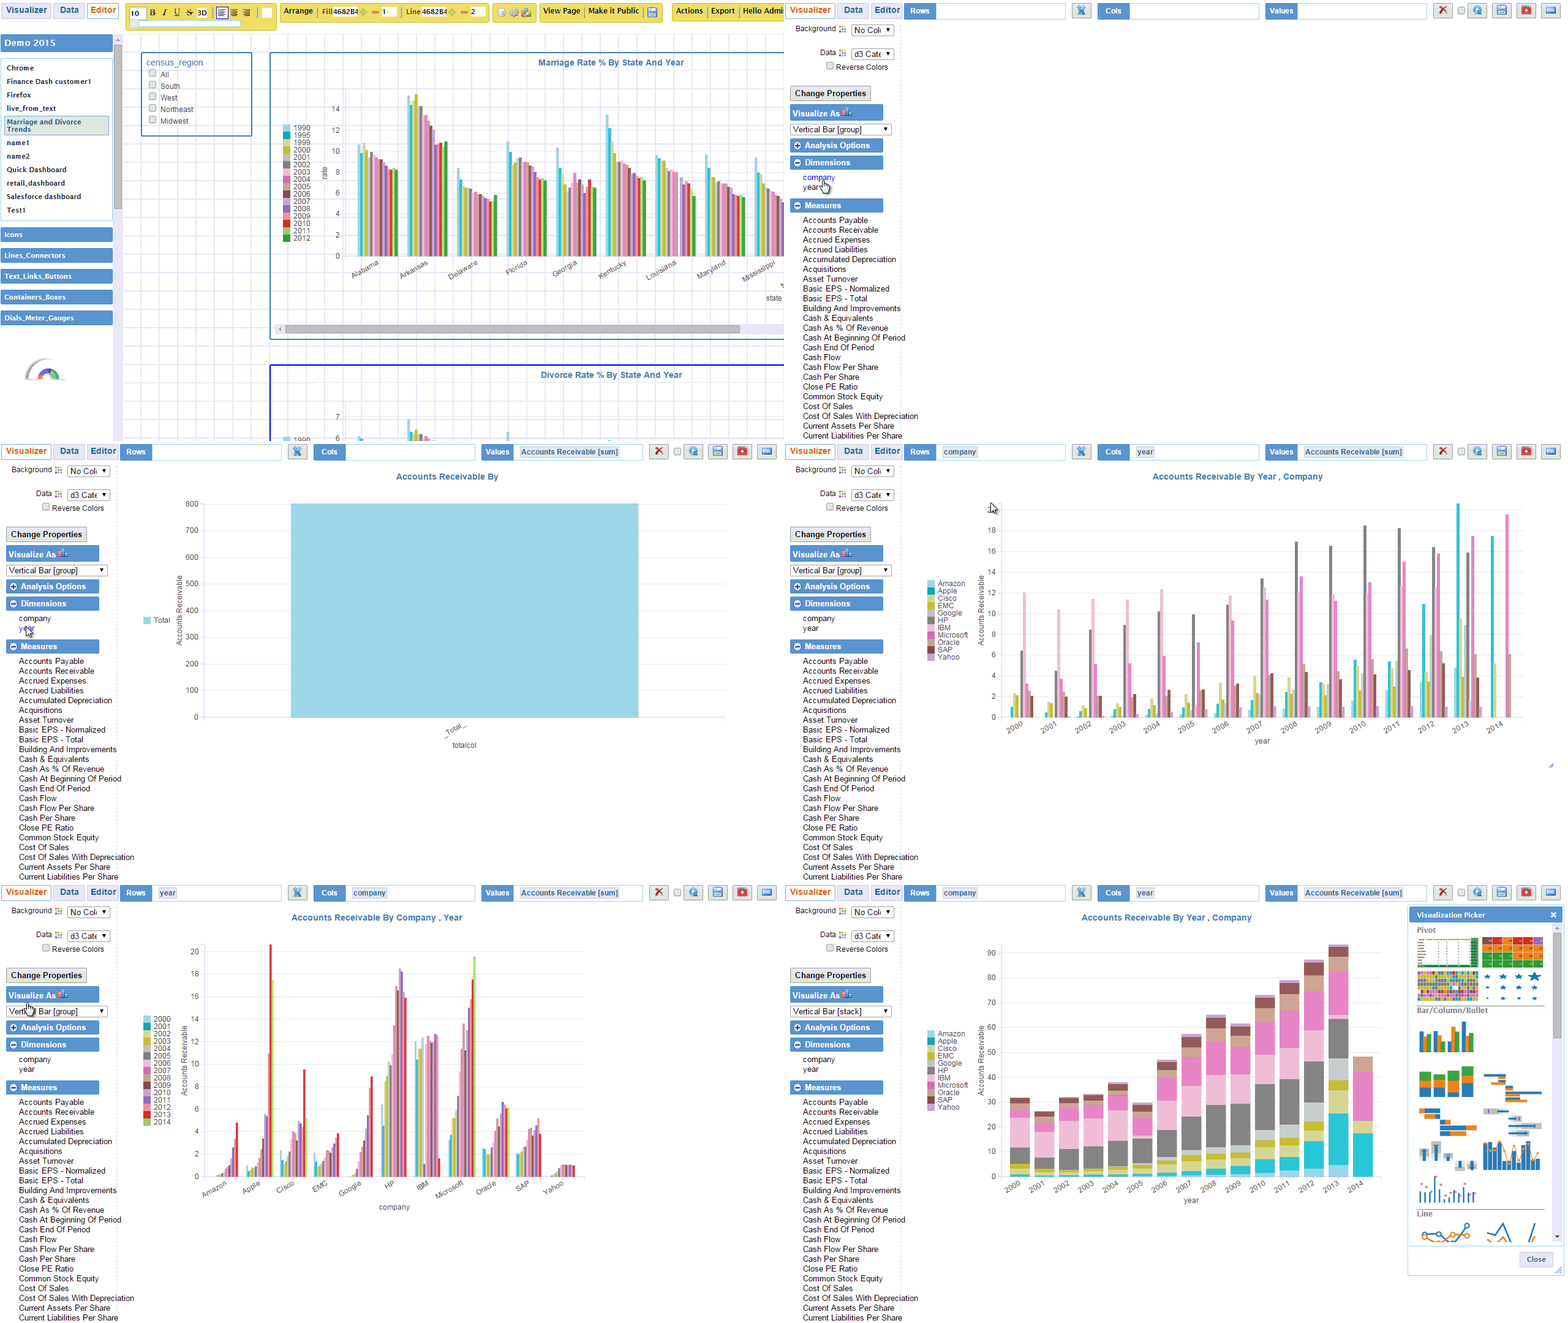
Here is our free visualization tool, get all your data into CSV files and use this tool absolutely free of cost and visualize and analyze to your heart’s content.
Remember, you don’t need dashboards to get insights from your data, a simple pivot table or sankey flow diagram is all your need to get the ‘Aha’ moment!

