
This article will explain how to add new Excel File connection
Visit http://127.0.0.1:4001/infocaptor/dash/connection_template.php?mode=excel
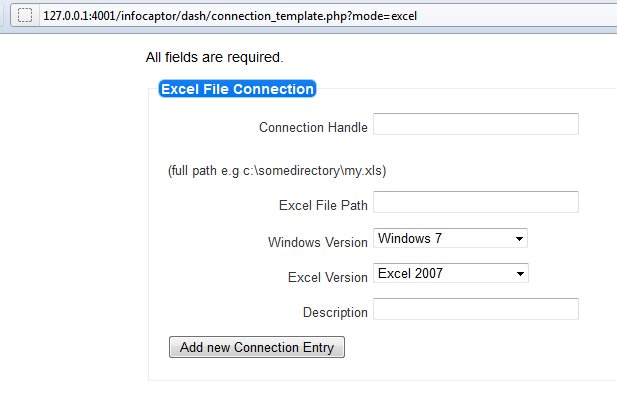
Assuming your excel file is located in the “c:samplestest_data.xls” the following entries are populated
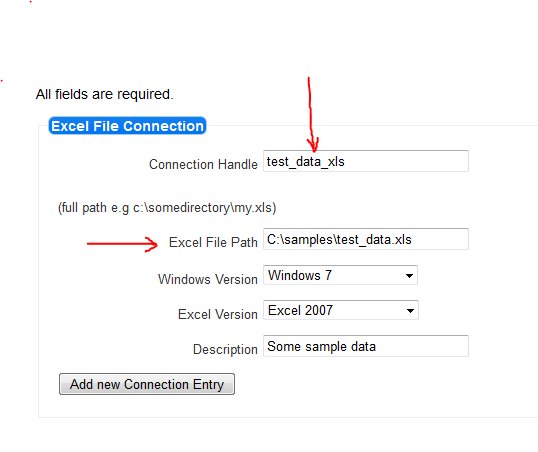
“Connection Handle” : This is an identifier for the excel file that will be used in the dashboard so name it appropriately so you can identify. Each Connection handle will appear in the data connection drop down list
“Excel File Path” : Type the exact Excel file and also verify the extension if it is .xls or .xlsx, or .xlsm or .xlsb
Then select the windows and excel version. Add some descritption and then click on the “Add new Connection Entry”
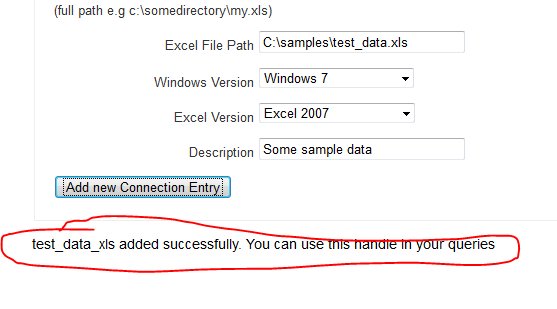
You should see the confirmation message below
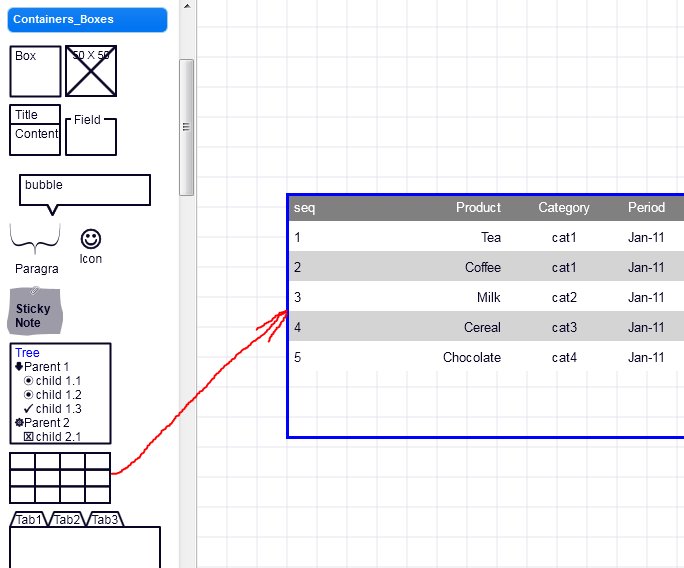
Now go back to the Dashboard Designer interface
And from the left panel, under the “Containers and Boxes” section we drag the “Grid” and drop it in the main canvas in the center
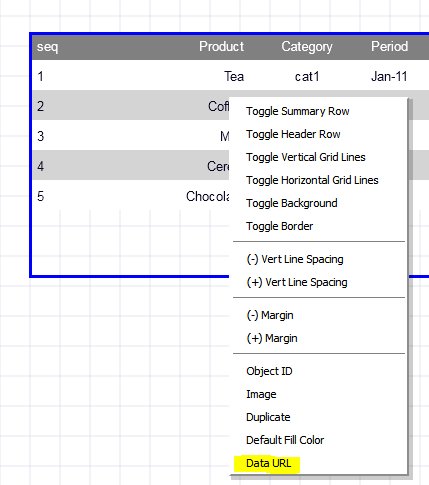
Now right click on the Grid
It will show a context menu
Find the “Data URL” item and click on it
this will open a new window as shown below
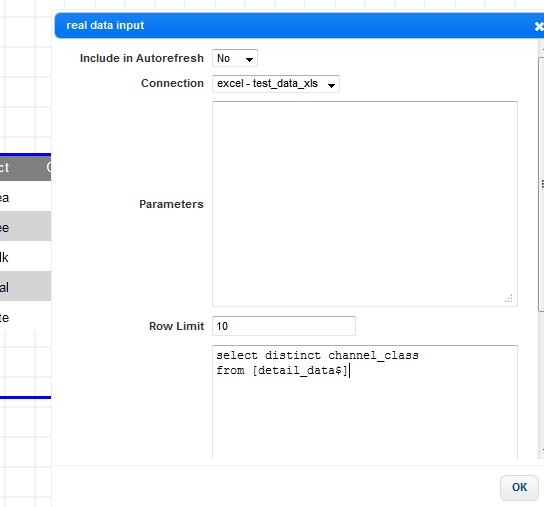
From the connection you can select the Excel handle that we defined earlier
In the SQL window you can type any valid SQL statement
Click “OK”
The SQL will execute and immediately update the Grid with the result it brought in
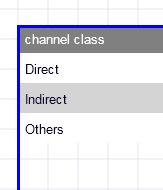
So this explains the basic data sourcing for Grid.
You can source data into the charts too but for charts make sure you are pulling the right number of columns and in the proper order.