
The field of marketing used to be a matter of simple advertising but times have changed. Back in the day, best advertisement got the most sales but today’s buyers are not so suggestible as in days of yore.
With the advent of Internet, even uneducated consumers have become wary of overt advertising. These days marketers have to appeal to a much more discerning base of buyers, and they also have to be able to demonstrate to their clients that the “newfangled” ways of marketing actually perform.
Data visualization is making the difference on both sides of this dilemma.
Data Visualization: the Breakdown
So what is data visualization? To answer that, we first have to answer the question, “what is data?”
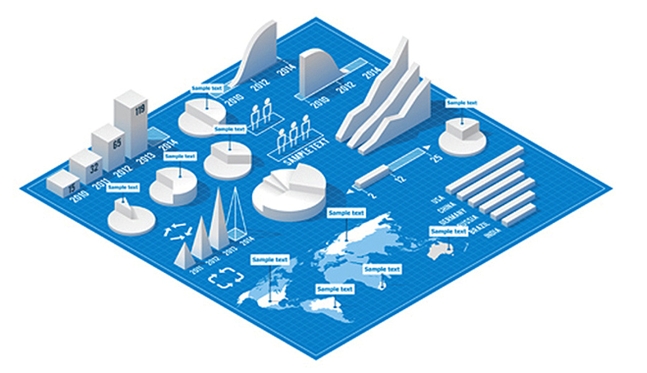
Data itself is nothing more complicated than information-statistics and numbers collected and categorized. Data visualization is a step that filters all that information into an easily understood format, a snapshot if you will. Taking a spreadsheet full of sales statistics, for example, and converting it to a bar graph or a pie chart.
With data visualization, a user doesn’t have to interpret all the information because it is presented in an easily digestible graphic that explains its own purpose. A bar graph of sales figures by the month is comprehensible at a glance, while the spreadsheet containing the numbers may not be so easily interpreted.
Using Data Visualization with Clients
People have a hard time arguing with facts; at least once they’re able to internalize those facts. Data visualization can help a marketer to guide a client to an understanding of underlying trends and results, showing indisputably how successfully a marketing campaign is performing.
When marketers identify key performance indicators (KPIs) in a campaign and are able to track those statistics, they have at their disposal all the proof they need to promote that campaign with the client.
Using Data Visualization Within an Organization
Data visualization isn’t only a tool to use with clients. Within their own organizations, marketers are increasingly relying on it to make the necessary alterations during a campaign. By monitoring KPIs in real time with a dashboard, a marketer can assess the current success of any given campaign and make adjustments as needed to improve performance.
Visual analytics provide easy insights into marketers’ own efforts, enabling an organization to make adjustments as they go, rather than waiting till the end of a campaign to find out that it underperformed.
The average amount of advertising budgets allotted to analytics has shot up by more than eighty percent, which is a telling indicator that data visualization is increasingly considered important in the marketing field.
In the field of marketing, decisions have always been guided by measurements and metrics, and the advent of data visualization and real-time dashboards have only upped the ante. With so many shifts in the field, data visualization is a solid tool that marketers are grasping with enthusiasm!