City of Chicago – Library WiFi usage – Visualization

Share on facebook
Share on twitter
Share on linkedin
Share on reddit
Share on email

Let us examine a case of how a simple chart with few colors can give instant insight into the underlying data.

Here is the plain old table of data from City of Chicago

Let us see how we can analyze it in different ways.

Image

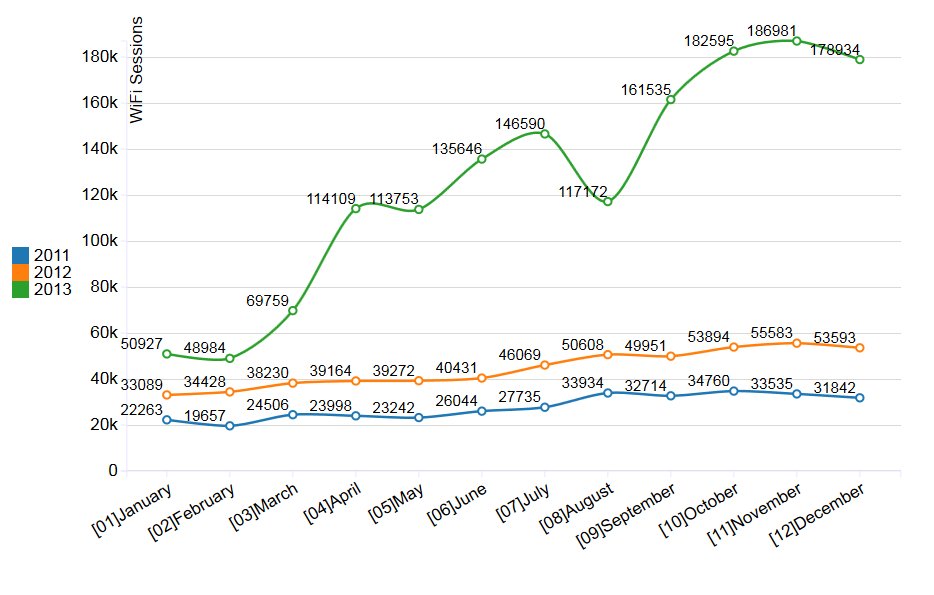
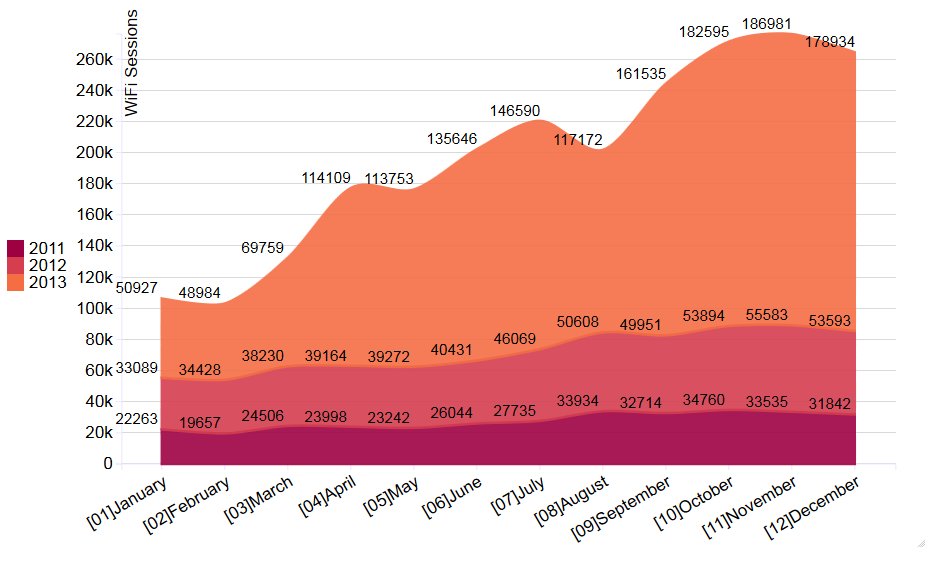
This simple line chart shows the growth of Library WiFi usage in 2013 compared to previous years. Notice the dip in 2013 during August timeframe.

Same data but different chart

Image

Image

Image

Image

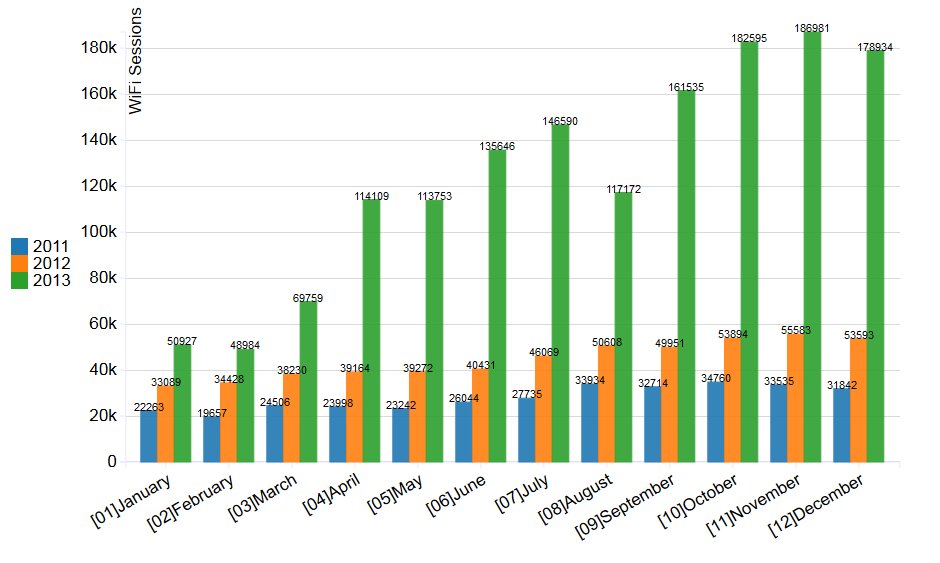
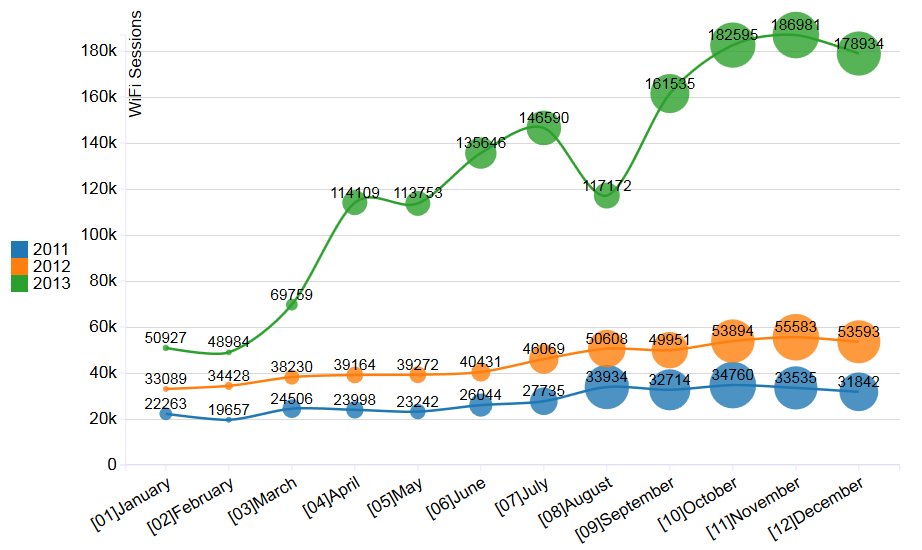
So which chart does a better justice?

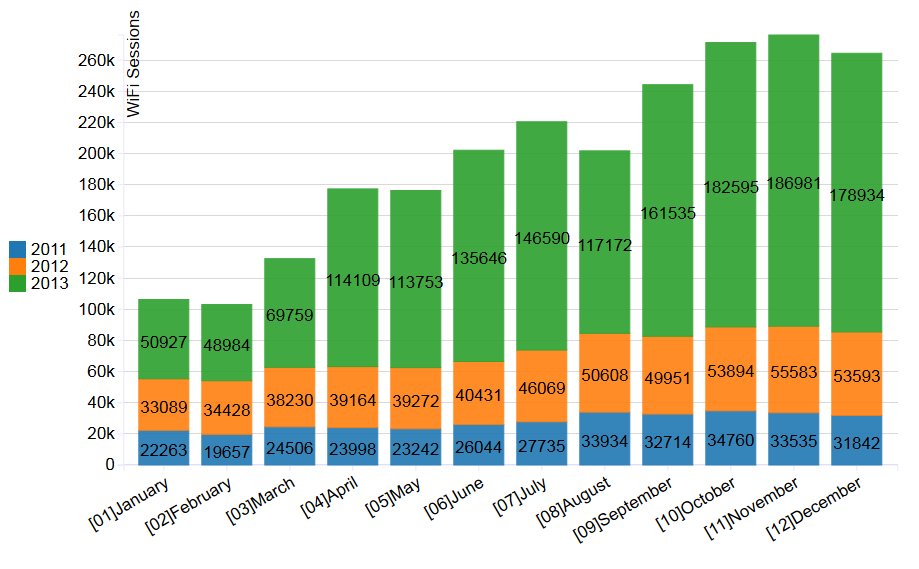
And here is how the original data looks like

Image

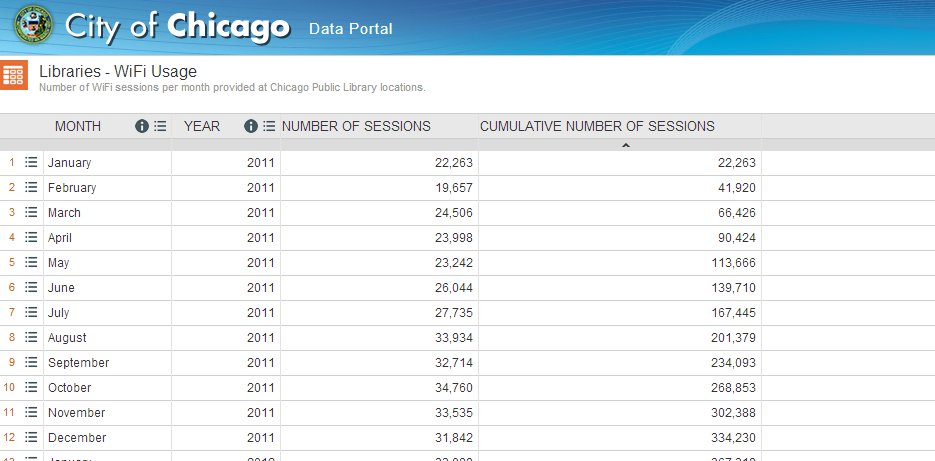
https://data.cityofchicago.org/Education/Libraries-WiFi-Usage/vbts-zqt4


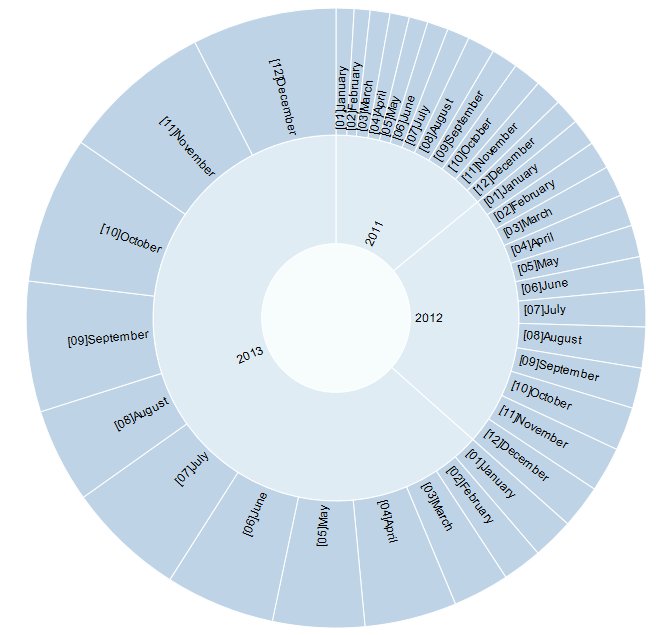
Finally, here is one extravagant option.

Image

The Core Tools

Create dashboard for any Database

Data Visualizer and Dashboard Application
SALE
This is the best dashboard software for its price. One good thing we did was to hire their consulting services to build few dashboard prototypes and provide some quick dashboard training.
- Terry Seal, IL
We evaluated Xcelsius and Qlikview and the cost for organization to implement dashboards was quoted over 10,000 USD. For fraction of the above quoted price, we were able to buy the licenses for the web based dashboard software and get some free training. This is truly a dashboard software for small businesses like us.
IT Manager of a Trucking company, OH