

Before we start, jump to this Top 500 CEO Compensation Dashboard
This cool visualization is built on top of a curated data of top 500 CEOs listed in order of their annual compensation, direct salary, number of shares, efficiency, rank and age. This list is generated by Forbes.com
This article is split in two parts, first we show what we built and then we will list the steps on how it was built.
When you launch the CEO dashboard you will see on the top, two sets of “Radio controls”
“View by” = CEO Name and CEO company
Next is the “Bubble Measure” = CEO Age, Rank, Efficiency, 1 yr pay, 5 yr pay and number of shares owned.
Here are the different visuals you get when you switch between the different dashboard filters.
Bubble Visualization by CEO Rank (as calculated by Forbes.com)
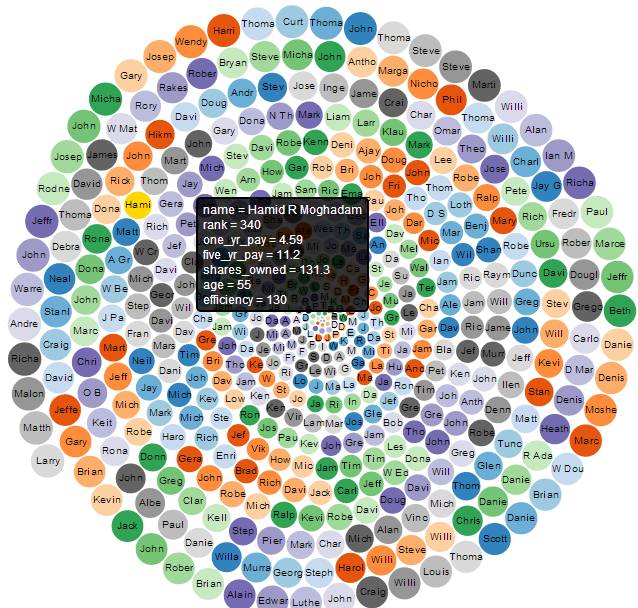
Forbes.com has applied some algorithm to derive at the efficiency factor for each CEO. Based on this efficiency factor, they have ranked the CEOs.
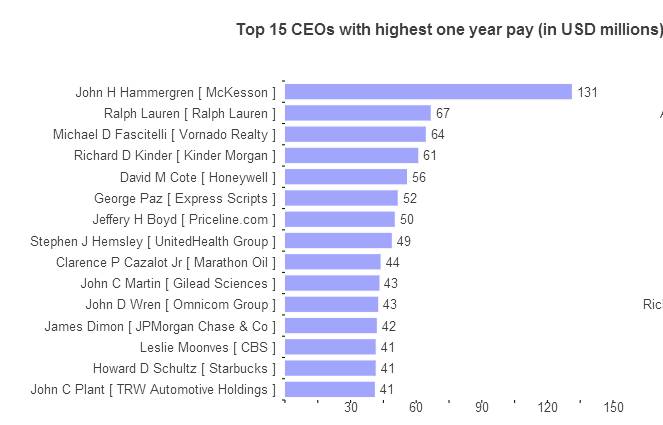
Now switch the bubble measure to 1 year pay
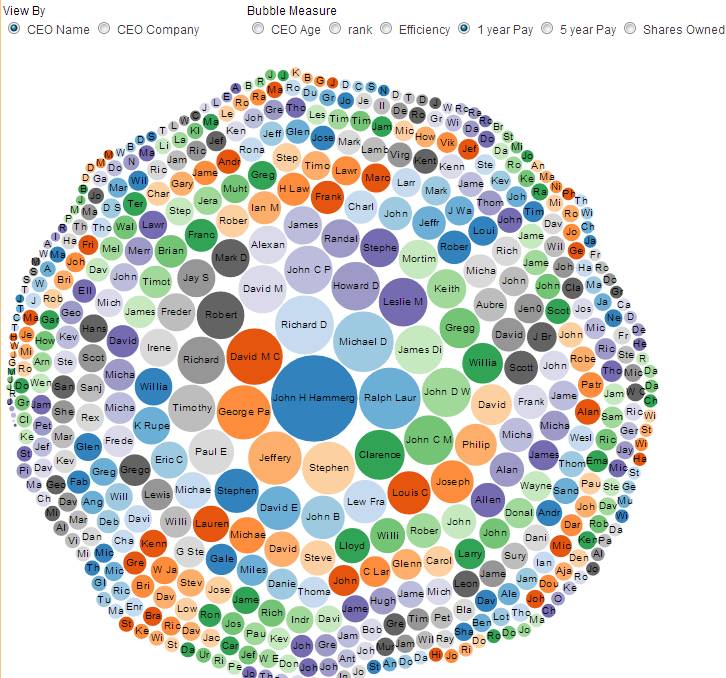
We can see that the top 20 CEO ordered by 1 year pay/compensation are as follows
1 John H Hammergren, McKesson
2 Ralph Lauren, Ralph Lauren
3 Michael D Fascitelli, Vornado Realty
4 Richard D Kinde,r Kinder Morgan
5 David M Cote, Honeywell
6 George Paz, Express Scripts
7 Jeffery H Boyd, Priceline.com
8 Stephen J Hemsley, UnitedHealth Group
9 Clarence P Cazalot Jr, Marathon Oil
10 John C Martin, Gilead Sciences
11 John D Wren, Omnicom Group
12 James Dimon, JPMorgan Chase & Co
13 Leslie Moonves, CBS
14 Howard D Schultz, Starbucks
15 John C Plant, TRW Automotive Holdings
16 David M Zaslav, Discovery Communications
17 Robert A Iger, Walt Disney
18 Richard C Adkerson, Freeport McMoRan Copper & Gold
19 Timothy M Manganello, BorgWarner
20 Paul E Jacobs, Qualcomm
Switch to 5 year pay
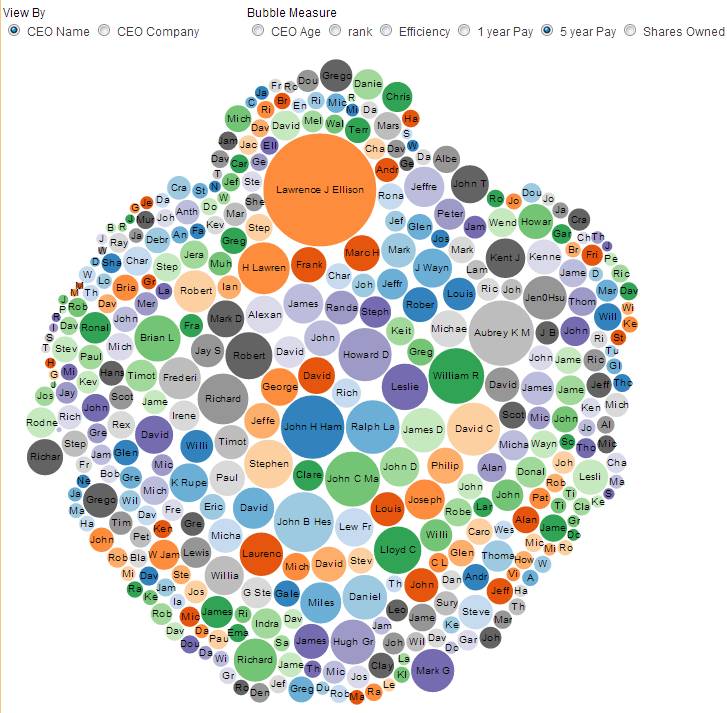
Look who is making the most of 5 year pay.
From the grid we can extract all the CEOs who make atleast 100 million in the total span of 5 years
106 Lawrence J Ellison, Oracle
59 Aubrey K McClendon, Chesapeake Energy
1 John H Hammergren, McKesson
23 John B Hess, Hess
29 William R Berkley, WR Berkley
10 John C Martin, Gilead Sciences
2 Ralph Lauren, Ralph Lauren
14 Howard D Schultz, Starbucks
28 David C Novak, Yum Brands
66 H Lawrence Culp Jr, Danaher
18 Richard C Adkerson, Freeport McMoRan Copper & Gold
8 Stephen J Hemsley, UnitedHealth Group
49 Lloyd C Blankfein, Goldman Sachs Group
17 Robert A Iger, Walt Disney
13 Leslie Moonves, CBS
70 Brian L Roberts, Comcast
134 Hugh Grant, Monsanto
83 Daniel P Amos, Aflac
12 James Dimon, JPMorgan Chase & Co
98 Jen0Hsun Huang, Nvidia
45 Laurence D Fink, BlackRock
333 Mark G Papa, EOG Resources
210 Richard B Handler, Jefferies Group
68 Robert J Stevens, Lockheed Martin
39 Frederick W Smith, FedEx
22 David E I Pyott, Allergan
82 Miles D White, Abbott Laboratories
255 Jeffrey C Sprecher, IntercontinentalExchange
26 Joseph M Tucci, EMC
35 James T Hackett, Anadarko Petroleum
157 Kent J Thiry, DaVita
11 John D Wren, Omnicom Group
79 William H Swanson, Raytheon
102 J Wayne Leonard, Entergy
42 K Rupert Murdoch, News Corp
24 Lew Frankfort, Coach
73 David J Lesar, Halliburton
397 John T Chambers, Cisco Systems
36 Alexander M Cutler, Eaton
6 George Paz, Express Scripts
Now let us check who owns the most shares
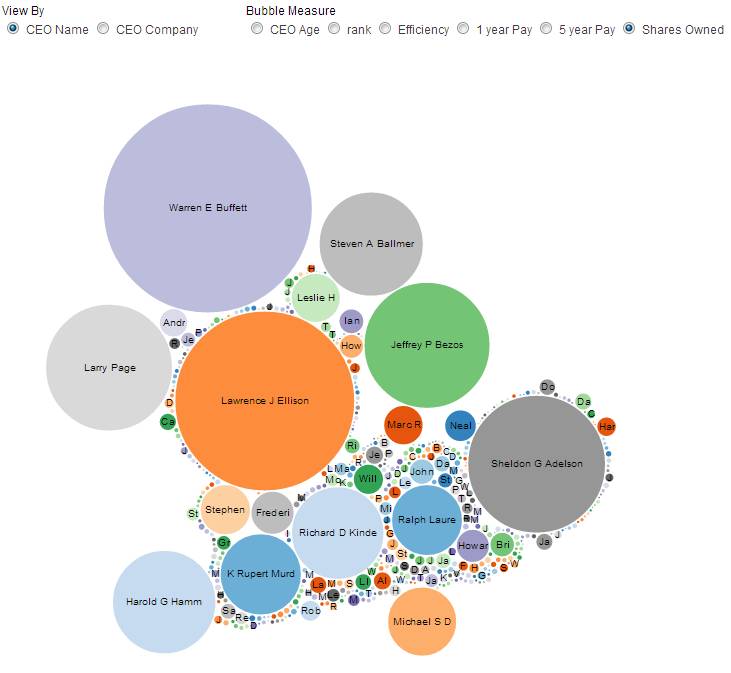
And here are the 20 top or so who own the most shares
495 Warren E Buffett, Berkshire Hathaway
106 Lawrence J Ellison, Oracle
178 Sheldon G Adelson, Las Vegas Sands
498 Larry Page, Google
470 Jeffrey P Bezos, Amazon.com
479 Steven A Ballmer, Microsoft
304 Harold G Hamm, Continental Resources
4 Richard D Kinde,r Kinder Morgan
42 K Rupert Murdoch, News Corp
2 Ralph Lauren, Ralph Lauren
347 Michael S Dell, Dell
108 Stephen A Wynn, Wynn Resorts
232 Leslie H Wexner, Limited Brands
39 Frederick W Smith, FedEx
465 Marc R Benioff, Salesforce.com
14 Howard D Schultz, Starbucks
441 Neal L Patterson, Cerner
29 William R Berkley, WR Berkley
496 Andrew D Mason, Groupon
23 John B Hess, Hess
474 Ian M Cumming, Leucadia National
70 Brian L Roberts, Comcast
227 Howard R Levine, Family Dollar Stores
Now let us try to visualize in the more traditional bar charts but apparently more effective.
Jump to this second CEO Compensation dashboard
Most Senior CEOs in the industry
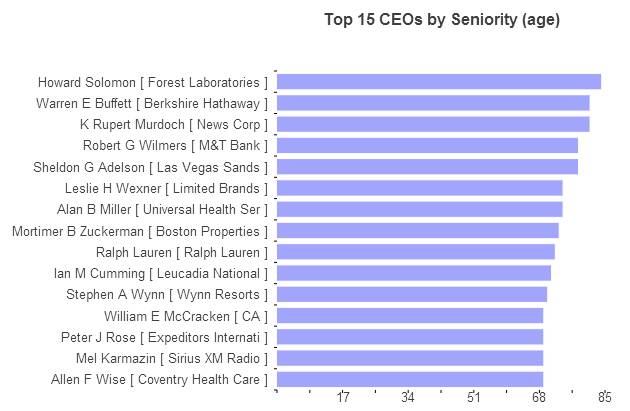
250 Howard Solomon Forest Laboratories
495 Warren E Buffett Berkshire Hathaway
42 K Rupert Murdoch News Corp
178 Sheldon G Adelson Las Vegas Sands
324 Robert G Wilmers M&T Bank
232 Leslie H Wexner Limited Brands
145 Alan B Miller Universal Health Services
32 Mortimer B Zuckerman Boston Properties
2 Ralph Lauren Ralph Lauren
474 Ian M Cumming Leucadia National
108 Stephen A Wynn Wynn Resorts
254 Peter J Rose Expeditors International of Washington
171 Mel Karmazin Sirius XM Radio
53 Allen F Wise Coventry Health Care
406 William E McCracken CA
93 James H Herbert II First Republic California
248 Robert H Benmosche American International Group
106 Lawrence J Ellison Oracle
4 Richard D Kinder Kinder Morgan
39 Frederick W Smith FedEx
367 William Dillard II Dillards
129 James A Skinner McDonalds
Youngest CEOs in the industry
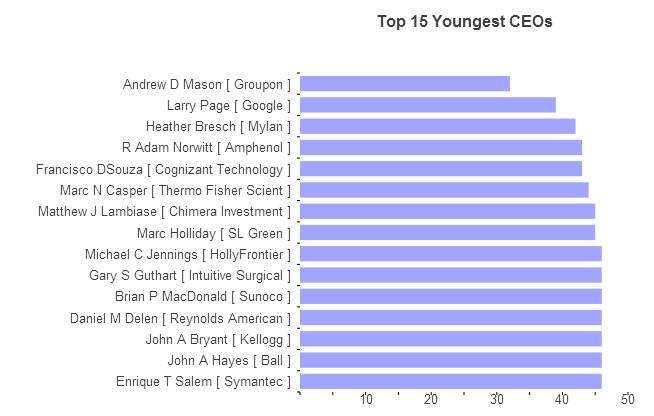
498 Larry Page Google
413 Heather Bresch Mylan
69 Francisco DSouza Cognizant Technology Solutions
412 R Adam Norwitt Amphenol
392 Marc N Casper Thermo Fisher Scientific
105 Marc Holliday SL Green
498 Matthew J Lambiase Chimera Investment
48 Steve Ells Chipotle Mexican Grill
285 John A Hayes Ball
488 Gary S Guthart Intuitive Surgical
489 Michael C Jennings HollyFrontier
321 John A Bryant Kellogg
124 David M Cordani Cigna
123 William C Rhodes III AutoZone
264 Enrique T Salem Symantec
410 Daniel M Delen Reynolds American
463 Brian P MacDonald Sunoco
347 Michael S Dell Dell
465 Marc R Benioff Salesforce.com
417 Gregory T Lucier Life Technologies
339 Thomas J Folliard CarMax
185 Gregory L Ebel Spectra Energy
470 Jeffrey P Bezos Amazon.com
343 W Benjamin Moreland Crown Castle International
115 John P Daane Altera
206 Darren R Jackson Advance Auto Parts
344 J Paul Raines GameStop
265 Brad D Smith Intuit
455 Luther C Kissam IV Albemarle
459 Louis J DAmbrosio Sears Holdings
So this illustrates how a bare bones tabular data was visualized to bring out some meaningful insigts.
Now let us see how this dashboard was built from scratch.
1. Data collection
First we collected the data from http://www.forbes.com/lists/2012/12/ceo-compensation-12_rank.html
and then copy pasted them into Excel. We had to massage, trim and truncate to strip out excess html codes and just keep the text part. One trick we stumbled was when you copy data from html page, it is best to paste it first into a plain text editor like notepad++ and then copy to Excel.
2. Upload data into InfoCaptor Datawarehouse
Check this tutorial on how to upload flat files or excel data into SQL database/ data warehouse
Once the data is loaded into the database we are ready to build our dashboard.
3. Bubble visualization
The technique to build the bubble viz is illustrated here Build bubble viz using SQL table data
4. Add Dashboard parameters and filters
Once you have the basic visuals done, you can add the dashboard radio controls to change the SQL into dynamic one.
The dashboard parameters, when you select a radio value, that value is passed as a column to the SQL underneath and then it generates a new data set on the fly. This data is then passed to the d3js script for the final visuals.
Here is the SQL query
select param<html_radio_d5>, param<html_radio_d4> ,one_yr_pay,five_yr_pay,shares_owned,
age,efficiency,rank
from ceo_pay_2012
The first two columns are dynamic and based on the dashboard filters. As the user selects different values, the sql changes and accordingly fetchs the columns in that order.
Hope you enjoyed the tutorial and let your imagination go wild. Turn that boring Excel Grid into something fancy!