
In this article we will use a XML data source and build it to display the various data sets in grid format.
This tutorial is an extension to the one you see in the documentation
https://www.infocaptor.com/help/xml.htm
All it uses is just XPATH syntax to extract various information.
Consider this XML document http://mtdemo.s3.amazonaws.com/StyleCopViolations.xml
This XML contains various compile time violations and has various attributes in the Violation tag.
We drag the HTML grid to the canvas
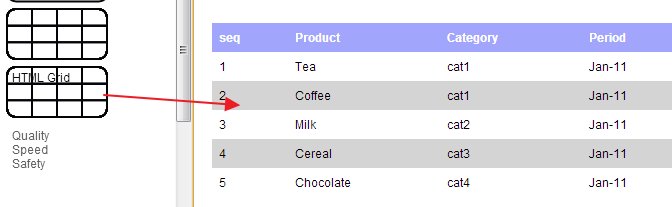
Right click on the Grid and select Data source
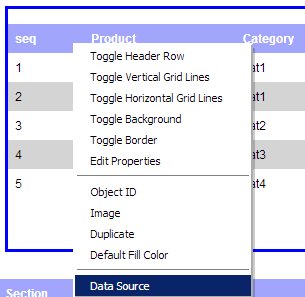
In the connection drop down select ‘HTTP Output as XML..’
And then click on “Add Default Values”
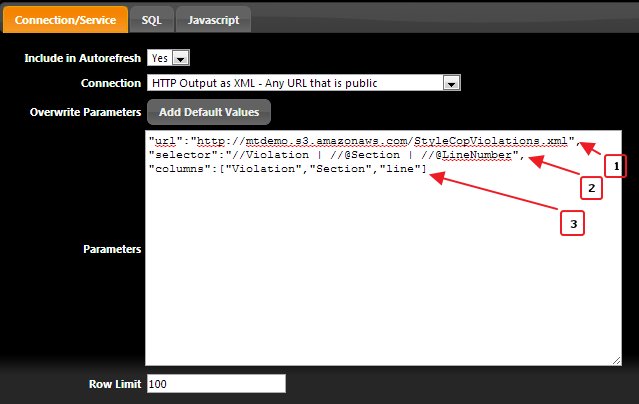
1. In the URL replace it with the source of the XML
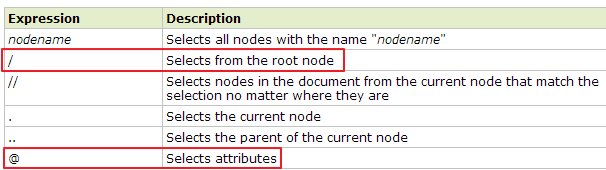
2. In the selector you have to provide a valid XPATH syntax.
For reference, http://www.w3schools.com/xpath/xpath_syntax.asp
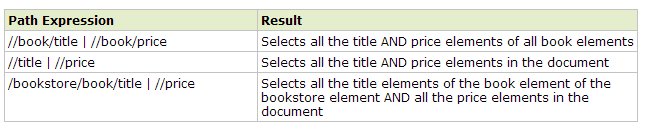
And another important reference is on how to combine multiple selectors together using the | operators
So, now let say we want to display the following highlighted elements
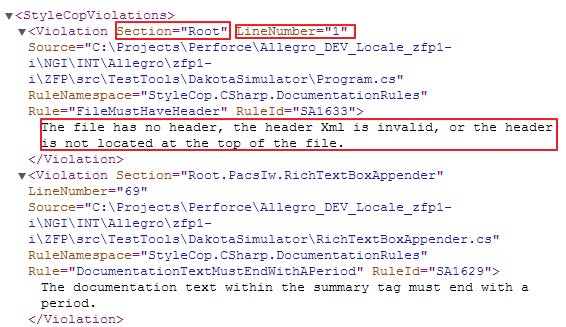
i.e Violation, section and linenumber
Based on the XPATH syntax, Violation tag is the node and section and linenumber are the attributes of the violation tag.
The syntax for node tag is //Violation and to access the attribute we use the ‘@’ sign in front of it.
And to bring multiple elements we use the ‘|’ operator.
Putting this all together, we have the following selector
“selector”:”//Violation | //@Section | //@LineNumber“,
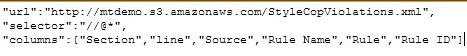
And our final Parameters should look like this
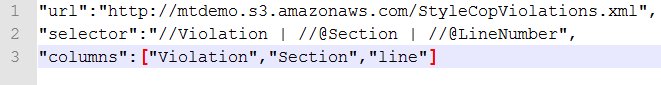
In the columns parameter, we give the name to each element we want to bring in. This provides a user friendly name to each element and the number of columns in this list should match the number of elements we are bringing in.
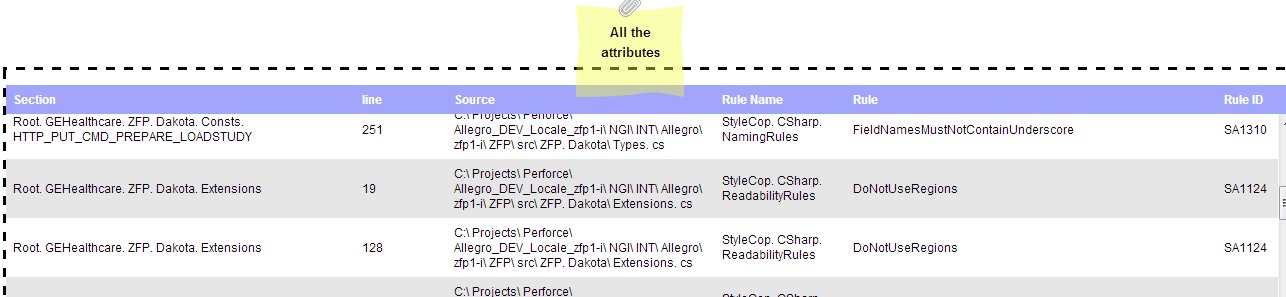
Once we are good, we click OK and instantly see the following results
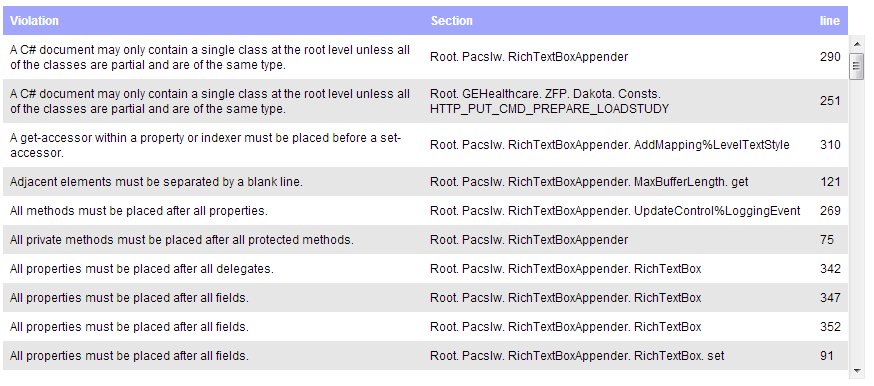
Now since the data in the second column did not contain any blank characters , it was difficult to wrap the text in the column.
To facilitate wrapping we write a small javascript post processing code that replaces the dot (.) with a dot followed by blank space.
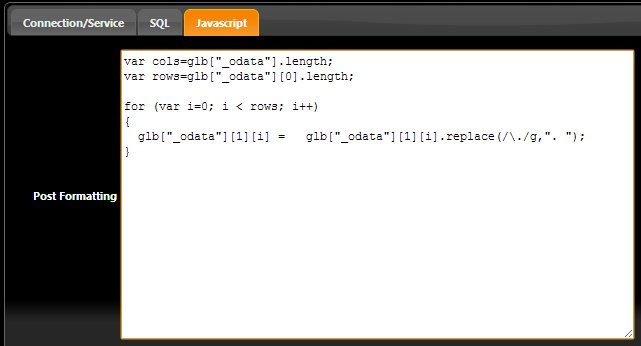
var cols=glb[“_odata”].length;
var rows=glb[“_odata”][0].length;
for (var i=0; i < rows; i++)
{
glb[“_odata”][1][i] = glb[“_odata”][1][i].replace(/\./g,”. “);
}
Similarly, let say if you wanted to display all the attributes you can use the “@*” selector
The @* will bring in all the attributes so we provide name for each column
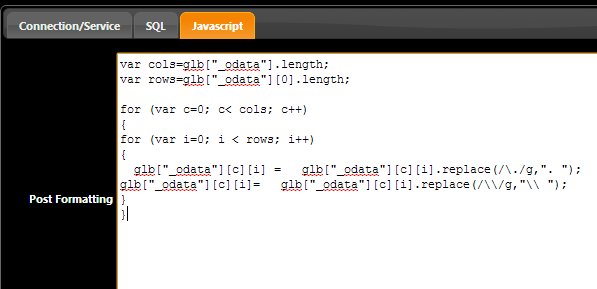
Again, in most of the attributes data that contains long text, there was no blank characters so we provide a javascript snippet in the Post JS section as follows
var cols=glb[“_odata”].length;
var rows=glb[“_odata”][0].length;
for (var c=0; c< cols; c++)
{
for (var i=0; i < rows; i++)
{
glb[“_odata”][c][i] = glb[“_odata”][c][i].replace(/\./g,”. “);
glb[“_odata”][c][i]= glb[“_odata”][c][i].replace(/\\/g,”\\ “);
}
}
The ‘|’ operator is very handy in this case because it acts like the ‘SELECT’ clause in SQL. This way you can bring in various elements together.