Alcohol Related Crashes : Data Analysis

Share on facebook
Share on twitter
Share on linkedin
Share on reddit
Share on email

In this article we will analyze the crash and accident data from the NHTSA website

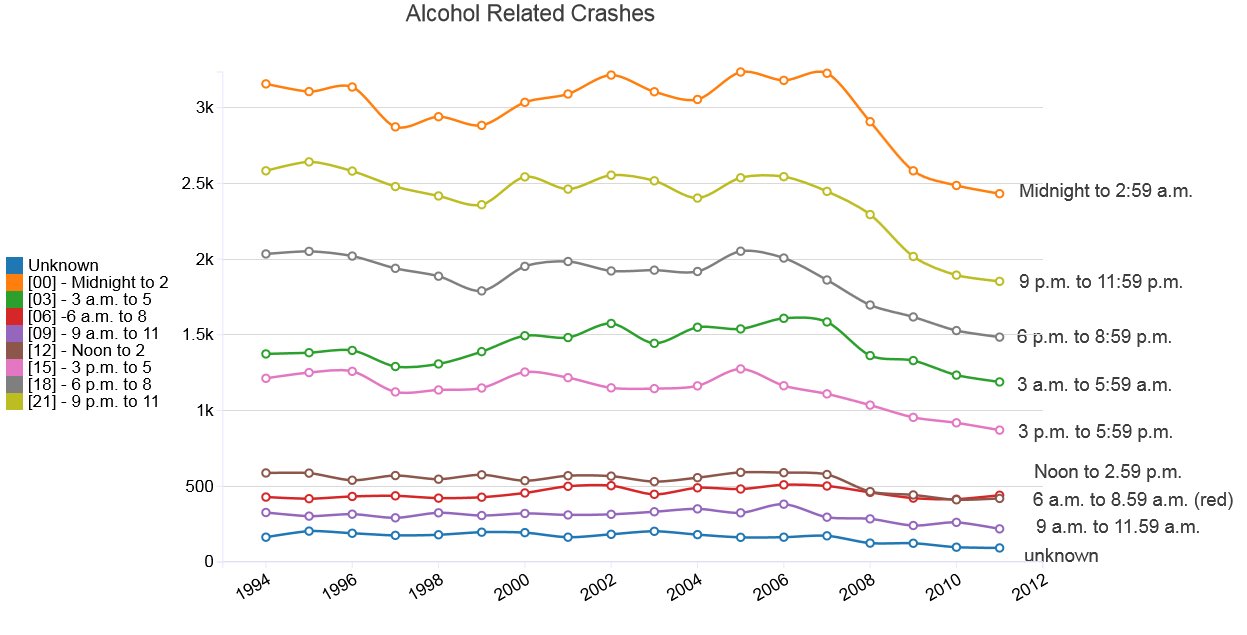
The data is provided by year and the time of the day. So going by the hunch, the accidents related to alcohol should be very high during the night time and less during the working hours.

Plotting this data we get
Image


The peak occurs between midnight and 3pm.

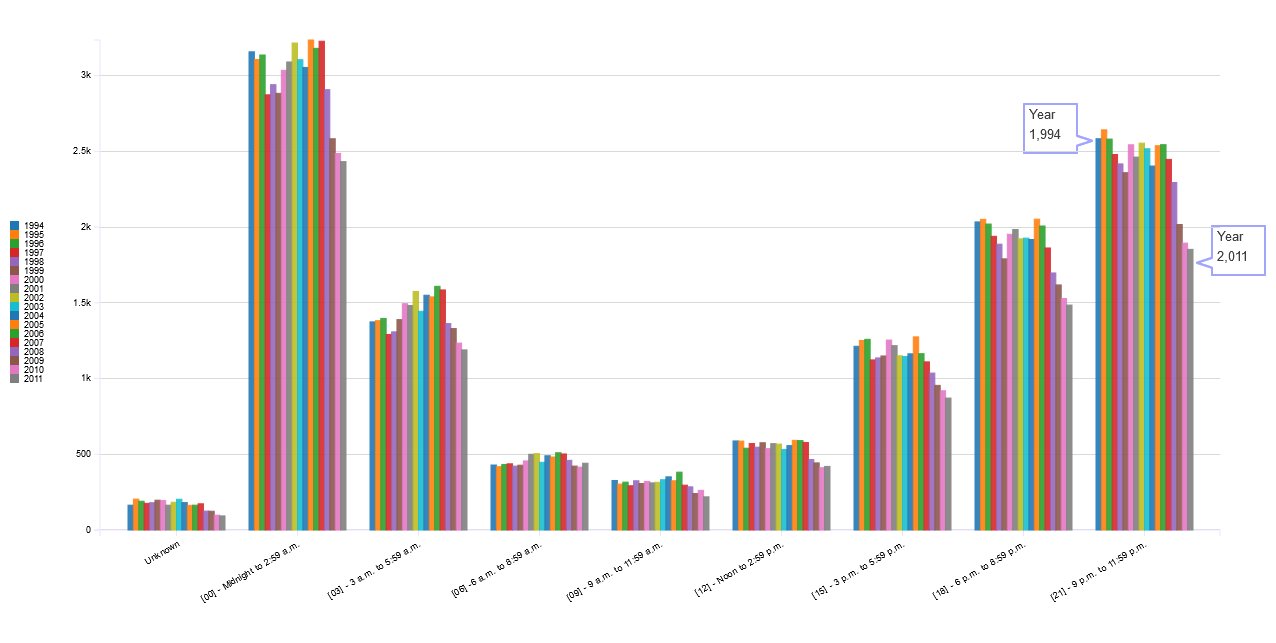
Now let us see how the trend is changing over the years
Image


In the above chart, each bar represents the year and you can see within each time slot how the trend is falling down. The right most bar represents 2011 and left most represents the year 1994.

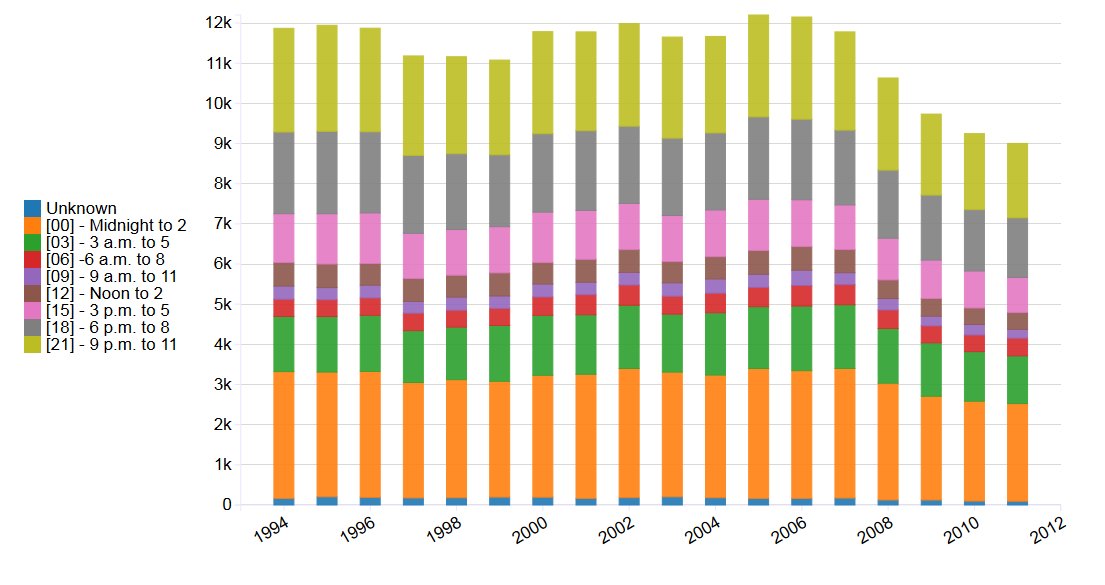
And here is another view
Image


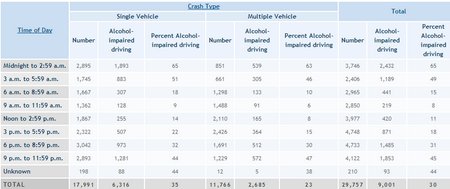
Here is how the data looks and it is provided by year.


Image


Image

The Core Tools

Create dashboard for any Database

Data Visualizer and Dashboard Application
SALE
This is the best dashboard software for its price. One good thing we did was to hire their consulting services to build few dashboard prototypes and provide some quick dashboard training.
- Terry Seal, IL
We evaluated Xcelsius and Qlikview and the cost for organization to implement dashboards was quoted over 10,000 USD. For fraction of the above quoted price, we were able to buy the licenses for the web based dashboard software and get some free training. This is truly a dashboard software for small businesses like us.
IT Manager of a Trucking company, OH